. 2011 Oct 14;286(41):35943-35954.
doi: 10.1074/jbc.M111.266064. Epub 2011 Aug 16.

Pigment epithelium-derived factor (PEDF) promotes tumor cell death by inducing macrophage membrane tumor necrosis factor-related apoptosis-inducing ligand (TRAIL)

Affiliations

Pigment epithelium-derived factor (PEDF) promotes tumor cell death by inducing macrophage membrane tumor necrosis factor-related apoptosis-inducing ligand (TRAIL)

Tsung-Chuan Ho et al. J Biol Chem. .

Abstract

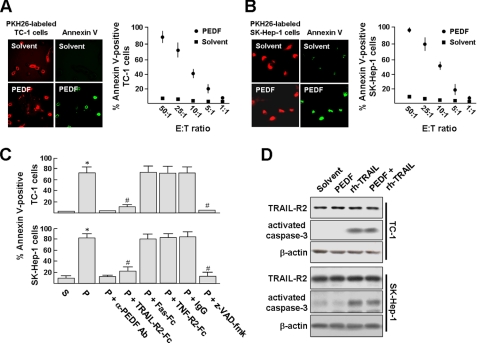
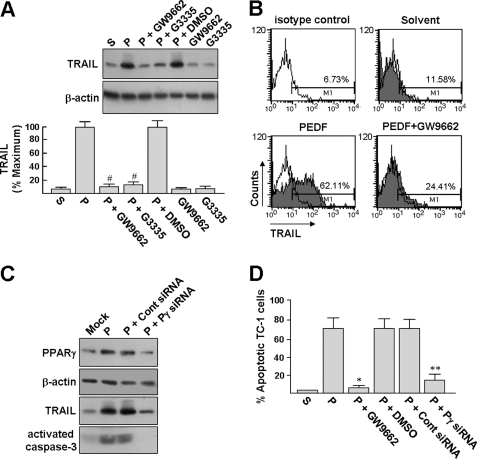
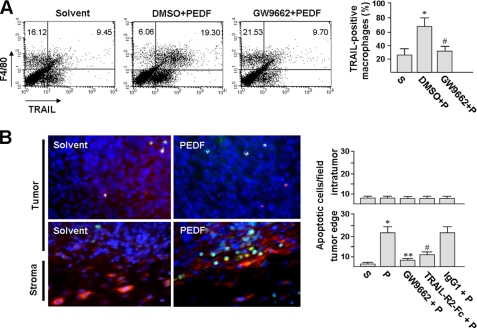
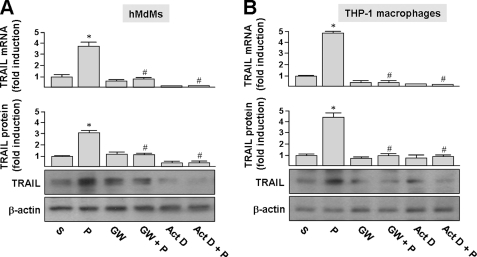
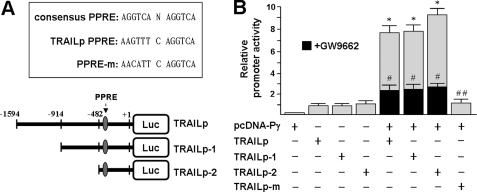
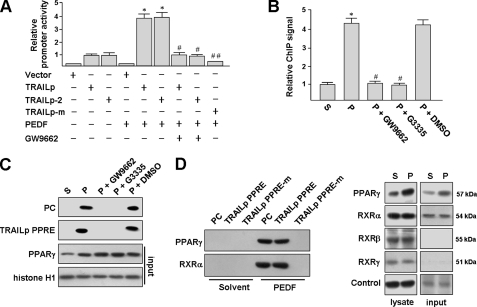
Pigment epithelium-derived factor (PEDF) is an intrinsic anti-angiogenic factor and a potential anti-tumor agent. The tumoricidal mechanism of PEDF, however, has not been fully elucidated. Here we report that PEDF induces the apoptosis of TC-1 and SK-Hep-1 tumor cells when they are cocultured with bone marrow-derived macrophages (BMDMs). This macrophage-mediated tumor killing is prevented by blockage of TNF-related apoptosis-inducing ligand (TRAIL) following treatment with the soluble TRAIL receptor. PEDF also increases the amount of membrane-bound TRAIL on cultured mouse BMDMs and on macrophages surrounding subcutaneous tumors. PEDF-induced tumor killing and TRAIL induction are abrogated by peroxisome proliferator-activated receptor γ (PPARγ) antagonists or small interfering RNAs targeting PPARγ. PEDF also induces PPARγ in BMDMs. Furthermore, the activity of the TRAIL promoter in human macrophages is increased by PEDF stimulation. Chromatin immunoprecipitation and DNA pull-down assays confirmed that endogenous PPARγ binds to a functional PPAR-response element (PPRE) in the TRAIL promoter, and mutation of this PPRE abolishes the binding of the PPARγ-RXRα heterodimer. Also, PPARγ-dependent transactivation and PPARγ-RXRα binding to this PPRE are prevented by PPARγ antagonists. Our results provide a novel mechanism for the tumoricidal activity of PEDF, which involves tumor cell killing via PPARγ-mediated TRAIL induction in macrophages.


Figures

FIGURE 1.
FIGURE 1.
PEDF stimulates macrophage-mediated cytotoxicity in a TRAIL-dependent manner. A and B, left panels, BMDMs were cocultured with PKH-26-labeled TC-1 cells or SK-Hep-1 cells (red) at an effector/target ratio of 25:1 for 16 h and then stimulated with PEDF or its solvent for 24 h. Cell apoptosis was visualized via in situ staining using annexin V-FITC (green). Original magnification was ×400. Right panels, PKH-26-labeled TC-1 or SK-Hep-1 target cells were cultured with BMDMs at various effector/target ratios and then stimulated with PEDF. Percentages of annexin V-FITC-positive TC-1 and SK-Hep-1 cells were then determined and presented as the mean ± S.D. (error bars) of triplicate cultures. Experiments were repeated at least three times. C, BMDMs cocultured with TC-1 or SK-Hep-1 cells at an effector/target ratio of 25:1 were stimulated with PEDF (P) or PEDF solvent (S) for 6 h and then treated with soluble TRAIL-R2-Fc (20 ng/ml), Fas-Fc (20 ng/ml), TNF-R2-Fc (20 ng/ml), isotype control IgG1, or 20 μm benzyloxycarbonyl-VAD(OMe)-fluoromethylketone. After 18 h, apoptotic rates were determined by in situ annexin V-FITC staining and presented as the mean ± S.D. of triplicate cultures. To validate the PEDF specificity, PEDF was depleted from its solvent using an anti-PEDF antibody·protein A-Sephadex complex. *, p < 0.002 versus solvent; #, p < 0.005 versus PEDF. D, TC-1 and SK-Hep-1 cells express death receptor TRAIL-R2 (DR5) and are susceptible to TRAIL-mediated apoptosis. Expression of TRAIL-R2 in tumor cells was determined by Western blotting. TRAIL-mediated apoptosis was assessed by culturing cells with 200 ng/ml recombinant human soluble FLAG-tagged TRAIL (rh-TRAIL) for 24 h. The levels of activated caspase-3 (∼17 kDa) were determined by Western blotting. Representative results from three separate experiments are shown.
FIGURE 2.
FIGURE 2.
PEDF induces expressions of TRAIL and PPARγ in BMDMs. A, BMDMs were treated with PEDF at the indicated concentrations for 24 h, and the cells were then processed for RT-PCR analysis. GAPDH expression was examined for normalization purposes. B, cells were treated as described above, and proteins were detected by Western blot analysis with antibodies as indicated. Representative blots (left panels) and densitometric analysis with S.D. (error bars) (right panels) of three independent experiments are shown. *, p < 0.05 versus untreated cells. C, BMDMs were exposed to PEDF for the time indicated and then harvested for Western blotting with antibodies against TRAIL (∼33.4 kDa) and PPARγ (∼57.6 kDa). Equal protein loading was confirmed by reprobing the membranes with a β-actin antibody. Representative blots and densitometric analyses with S.D. from four separate experiments are shown. D, PEDF-treated BMDMs were assessed for cell surface TRAIL expression. BMDMs were treated with PEDF or its solvent for 24 h. Cell membrane and cytosolic fractions were isolated as described under “Experimental Procedures” and then subjected to Western blot analysis. A representative result from two independent experiments is shown. E, BMDMs were treated with PEDF or solvent control for 24 h. The cells were then incubated with PE-conjugated isotypic control or PE-conjugated TRAIL antibody and analyzed by flow cytometry.
FIGURE 3.
FIGURE 3.
PEDF mediates the induction of TRAIL expression by PPARγ. A, PPARγ antagonists suppress PEDF-induced TRAIL expression. BMDMs were pretreated with 10 μm GW9662 or G3335 for 1 h and then treated with or without 200 ng/ml PEDF (P) for an additional 24 h. Cells were harvested for Western blot analysis. Loading equality was confirmed with antibodies against β-actin. Representative blots and densitometric analyses with S.D. (error bars) from three separate experiments are shown. #, p < 0.005 versus PEDF + DMSO. B, surface expression of TRAIL was quantified by flow cytometry. BMDMs were exposed to PEDF or PEDF solvent for 24 h or pretreated with 10 μm GW9662 for 1 h before exposure to PEDF for an additional 24 h. The cells were then stained with PE-conjugated isotypic control or anti-TRAIL antibody for analysis by flow cytometry. Data shown are from one representative experiment of four. C, PPARγ siRNA abrogates PEDF-induced TRAIL expression. BMDMs were transfected with a PPARγ siRNA or control siRNA for 16 h and allowed to recover for a further 24 h. Mock, cells were treated with transfection reagents alone. After the respective treatment, both BMDMs and siRNA-transfected BMDMs were exposed to PEDF for 24 h, and the cells were then harvested for Western blot analysis (blots 1–3). The siRNA-transfected BMDMs were also used for coculture with TC-1 cells at an effector/target ratio of 25:1 for 16 h and then exposed to PEDF for a further 24 h, followed by detection of activated caspase-3 by Western blot analysis. Representative results from three separate experiments are shown. D, PPARγ antagonist and siRNA block the BMDM-mediated cytotoxicity induced by PEDF, GW9662, and siRNAs pretreatments were performed as described above, followed by PEDF treatment for an additional 24 h. BMDM-mediated cytotoxicity was performed at an effector/target ratio of 25:1, and cell apoptosis was detected by annexin V-FITC staining as described in the legend to Fig. 1A. *, p < 0.001 versus PEDF + DMSO. **, p < 0.02 versus control siRNA + PEDF.
FIGURE 4.
FIGURE 4.
PEDF causes a TRAIL-mediated antitumor effect in a murine model. A, PEDF induces TRAIL expression in stromal macrophages. C57BL/6 mice with established TC-1 tumors were intraperitoneally injected with GW9662 or DMSO vehicle for 6 h, followed by peritumoral injections with PEDF (P) or PEDF solvent (S) control for a further 24 h as described under “Experimental Procedures.” After treatment, the mice were euthanized, and the tumors (n = 6) were processed for macrophage isolation. The freshly isolated macrophages were then double-stained with PE-conjugated anti-TRAIL and PerCP-conjugated anti-F4/80 antibodies for flow cytometry analysis. *, p < 0.02 versus solvent; #, p < 0.001 versus DMSO + PEDF. B, TRAIL-R2-Fc blocks PEDF-induced TC-1 cell apoptosis. C57BL/6 mice bearing TC-1 tumors were pretreated with or without GW9662 for 6 h and then injected around the tumor with PEDF or PEDF combined with TRAIL-R2-Fc or control IgG1. At day 2 post-treatment, tumors were harvested, and tumor sections were double-stained with TUNEL to identify apoptotic cells (green) and F4/80 to identify macrophages (red). Representative photographs revealed PEDF-induced tumor cell apoptosis in the peripheral tumor and in the vicinity of macrophages. Apoptotic TC-1 cells were quantified under a microscope (×400, 10 fields/tumor section) using a digital program. Data are representative of three individual experiments. *, p < 0.001 versus solvent. **, p < 0.001 versus PEDF. #, p < 0.005 versus PEDF + IgG1. Error bars, S.E.
FIGURE 5.
FIGURE 5.
PEDF induces TRAIL expression in human macrophages. A and B, hMdMs and THP-1 macrophages were treated with PEDF (P) or solvent (S) for 24 h or pretreated with 5 ng/ml actinomycin D (Act D) or 5 μm GW9662 (GW) for 1 h and then incubated with PEDF for an additional 24 h. Cells were then harvested and assayed by quantitative real-time PCR and Western blot analysis. TRAIL mRNA and protein expression were calculated as the -fold increase of TRAIL expression compared with the solvent-only control. Representative immunoblots and densitometric analysis with S.D. (error bars) are shown. *, p < 0.05 versus solvent-treated cells. #, p < 0.05 versus PEDF-treated cells.
FIGURE 6.
FIGURE 6.
A, sequence of the consensus PPRE and sequence of the candidate PPRE contained within the human TRAIL promoter 5′-flanking region. The location of the candidate PPRE (nt −382/−370) is marked with an arrow. The candidate PPRE mutated from GT to CA is designated as PPRE-m. Numbers are relative to the transcription start site (+1). The region spanning 1594 bp of the promoter was progressively deleted from its 5′-end and fused to the pGL3 basic vector. B, PPARγ transactivates the human TRAIL promoter. HuH-7 cells were transiently transfected with the indicated reporter construct in the presence or absence of the PPARγ-expressing plasmid, pcDNA-Pγ. Black columns represent cells that were treated with 20 μm GW9662 during transfection. Values (mean ± S.D. (error bars)) represent firefly luciferase activity normalized relative to a Renilla luciferase internal control. Luciferase activities are shown relative to the activity of the TRAILp vector, which was arbitrarily set to 1. *, p < 0.05 versus. TRAILp. #, p < 0.05 versus pcDNA-Pγ + TRAILp. ##, p < 0.001 versus pcDNA-Pγ + TRAILp.
FIGURE 7.
FIGURE 7.
PPARγ binds to the TRAIL promoter. A, PEDF enhances human TRAIL promoter activity. THP-1 macrophages were transfected with the indicated reporter construct. After 48 h post-transfection, cells were stimulated with PEDF or PEDF combined with 10 μm GW9662 for a further 24 h prior to reporter gene activity assays as described above. *, p < 0.05 versus. TRAILp. #, p < 0.05 versus PEDF + TRAILp. ##, p < 0.05 versus PEDF + TRAILp. B, ChIP assay. THP-1 macrophages were treated with PEDF (P) or PEDF solvent (S) for 24 h or pretreated with 10 μm GW9662 for 1 h and then incubated with PEDF for an additional 24 h. PPARγ-DNA complexes were immunoprecipitated with the anti-PPARγ antibody or IgG. Data are normalized to IgG immunoprecipitated DNA and input DNA. The binding of PPARγ to the TRAIL promoter in PEDF-stimulated THP-1 macrophages was measured and quantified by real-time PCR. C and D, identification of PPARγ and PPRE association by DNA pull-down assay. The 5′-biotinylated double-stranded oligonucleotides containing a consensus PPRE (positive control (PC)) or TRAILp PPRE or its mutant, as indicated in Fig. 6A, were used to precipitate PPARγ and RXRα from nuclear protein extracts of THP-1 macrophages treated with PEDF or its solvent. The mixtures were mixed with or without PPARγ antagonists (reaching a final concentration of 20 μm) and then pulled down by streptavidin beads. The proteins in the complex were analyzed by Western blotting using antibodies against PPARγ or RXR isoforms. Aliquots of nuclear extracts were also analyzed before the DNA pull-down assay (input). Shown are representative experiments that were repeated four times with similar observations. Error bars, S.E.

Similar articles

Cited by

References

    1. Steele F. R., Chader G. J., Johnson L. V., Tombran-Tink J. (1993) Proc. Natl. Acad. Sci. U.S.A. 90, 1526–1530 - PMC - PubMed
    1. Dawson D. W., Volpert O. V., Gillis P., Crawford S. E., Xu H., Benedict W., Bouck N. P. (1999) Science 285, 245–248 - PubMed
    1. Zhang S. X., Wang J. J., Gao G., Shao C., Mott R., Ma J. X. (2006) FASEB J. 20, 323–335 - PubMed
    1. Tombran-Tink J., Mazuruk K., Rodriguez I. R., Chung D., Linker T., Englander E., Chader G. J. (1996) Mol. Vis. 2, 11. - PubMed
    1. Guan M., Pang C. P., Yam H. F., Cheung K. F., Liu W. W., Lu Y. (2004) Cancer Gene Ther. 11, 325–332 - PubMed

Publication types

MeSH terms

LinkOut - more resources