Hemolysin induces Toll-like receptor (TLR)-independent apoptosis and multiple TLR-associated parallel activation of macrophages
- PMID: 21846723
- PMCID: PMC3186420
- DOI: 10.1074/jbc.M111.241851
Hemolysin induces Toll-like receptor (TLR)-independent apoptosis and multiple TLR-associated parallel activation of macrophages
Abstract
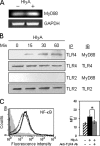
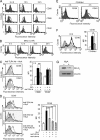
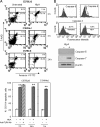
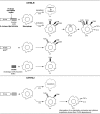
Vibrio cholerae hemolysin (HlyA) displays bipartite property while supervising macrophages (MΦ). The pore-forming toxin causes profound apoptosis within 3 h of exposure and in parallel supports activation of the defying MΦ. HlyA-induced apoptosis of MΦ remains steady for 24 h, is Toll-like receptor (TLR)-independent, and is driven by caspase-9 and caspase-7, thus involving the mitochondrial or intrinsic pathway. Cell activation is carried forward by time dependent up-regulation of varying TLRs. The promiscuous TLR association of HlyA prompted investigation, which revealed the β-prism lectin domain of HlyA simulated TLR4 up-regulation by jacalin, a plant lectin homologue besides expressing CD86 and type I cytokines TNF-α and IL-12. However, HlyA cytolytic protein domain up-regulated TLR2, which controlled CD40 for continuity of cell activation. Expression of TOLLIP before TLR2 and TLR6 abrogated TLR4, CD40, and CD86. We show that the transient expression of TOLLIP leading to curbing of activation-associated capabilities is a plausible feedback mechanism of MΦ to deploy TLR2 and prolong activation involving CD40 to encounter the HlyA cytolysin domain.
Figures


Similar articles
-
Synergism of toll-like receptor 2 (TLR2), TLR4, and TLR6 ligation on the production of tumor necrosis factor (TNF)-alpha in a spontaneous arthritis animal model of interleukin (IL)-1 receptor antagonist-deficient mice.Immunol Lett. 2009 Apr 27;123(2):138-43. doi: 10.1016/j.imlet.2009.03.004. Epub 2009 Mar 21. Immunol Lett. 2009. PMID: 19428561
-
Porin-incorporated liposome induces Toll-like receptors 2- and 6-dependent maturation and type 1 response of dendritic cell.Int Immunol. 2008 Dec;20(12):1551-63. doi: 10.1093/intimm/dxn114. Epub 2008 Oct 17. Int Immunol. 2008. PMID: 18931363
-
Porin of Shigella dysenteriae activates mouse peritoneal macrophage through Toll-like receptors 2 and 6 to induce polarized type I response.Mol Immunol. 2007 Feb;44(5):812-20. doi: 10.1016/j.molimm.2006.04.007. Epub 2006 Jun 5. Mol Immunol. 2007. PMID: 16750567
-
Activation of Toll-like receptors by Burkholderia pseudomallei.BMC Immunol. 2008 Aug 8;9:46. doi: 10.1186/1471-2172-9-46. BMC Immunol. 2008. PMID: 18691413 Free PMC article.
-
Vibrio cholerae cytolysin induces pro-inflammatory and death signals through novel TLR assembly.PLoS Pathog. 2025 Apr 4;21(4):e1013033. doi: 10.1371/journal.ppat.1013033. eCollection 2025 Apr. PLoS Pathog. 2025. PMID: 40184418 Free PMC article.
Cited by
-
The β-prism lectin domain of Vibrio cholerae hemolysin promotes self-assembly of the β-pore-forming toxin by a carbohydrate-independent mechanism.J Biol Chem. 2014 Feb 14;289(7):4001-8. doi: 10.1074/jbc.M113.522284. Epub 2013 Dec 19. J Biol Chem. 2014. PMID: 24356964 Free PMC article.
-
Signaling beyond Punching Holes: Modulation of Cellular Responses by Vibrio cholerae Cytolysin.Toxins (Basel). 2015 Aug 21;7(8):3344-58. doi: 10.3390/toxins7083344. Toxins (Basel). 2015. PMID: 26308054 Free PMC article. Review.
-
Vibrio cholerae hemolysin: The β-trefoil domain is required for folding to the native conformation.Biochem Biophys Rep. 2016 Sep 22;8:242-248. doi: 10.1016/j.bbrep.2016.09.009. eCollection 2016 Dec. Biochem Biophys Rep. 2016. PMID: 28955962 Free PMC article.
-
Enigmatic roles of Vibrio cholerae hemolysin/cytolysin in the bacterial pathogenesis and host-pathogen interactions.J Bacteriol. 2025 Aug 21;207(8):e0024825. doi: 10.1128/jb.00248-25. Epub 2025 Jul 28. J Bacteriol. 2025. PMID: 40719435 Free PMC article. Review.
-
Analysis of the Human Mucosal Response to Cholera Reveals Sustained Activation of Innate Immune Signaling Pathways.Infect Immun. 2018 Jan 22;86(2):e00594-17. doi: 10.1128/IAI.00594-17. Print 2018 Feb. Infect Immun. 2018. PMID: 29133347 Free PMC article.
References
MeSH terms
Substances
LinkOut - more resources
Full Text Sources
Research Materials

