. 2011 Nov;39(21):9181-93.
doi: 10.1093/nar/gkr654. Epub 2011 Aug 16.

Nuclear hormone 1α,25-dihydroxyvitamin D3 elicits a genome-wide shift in the locations of VDR chromatin occupancy

Affiliations

Nuclear hormone 1α,25-dihydroxyvitamin D3 elicits a genome-wide shift in the locations of VDR chromatin occupancy

Sami Heikkinen et al. Nucleic Acids Res. 2011 Nov.

Abstract

A global understanding of the actions of the nuclear hormone 1α,25-dihydroxyvitamin D(3) (1α,25(OH)(2)D(3)) and its vitamin D receptor (VDR) requires a genome-wide analysis of VDR binding sites. In THP-1 human monocytic leukemia cells we identified by ChIP-seq 2340 VDR binding locations, of which 1171 and 520 occurred uniquely with and without 1α,25(OH)(2)D(3) treatment, respectively, while 649 were common. De novo identified direct repeat spaced by 3 nucleotides (DR3)-type response elements (REs) were strongly associated with the ligand-responsiveness of VDR occupation. Only 20% of the VDR peaks diminishing most after ligand treatment have a DR3-type RE, in contrast to 90% for the most growing peaks. Ligand treatment revealed 638 1α,25(OH)(2)D(3) target genes enriched in gene ontology categories associated with immunity and signaling. From the 408 upregulated genes, 72% showed VDR binding within 400 kb of their transcription start sites (TSSs), while this applied only for 43% of the 230 downregulated genes. The VDR loci showed considerable variation in gene regulatory scenarios ranging from a single VDR location near the target gene TSS to very complex clusters of multiple VDR locations and target genes. In conclusion, ligand binding shifts the locations of VDR occupation to DR3-type REs that surround its target genes and occur in a large variety of regulatory constellations.


Figures

Figure 1.
Figure 1.
VDR binding locations and genomic distribution in unstimulated and 1α,25(OH)2D3-treated THP-1 cells. ChIP-Seq was performed from chromatin templates extracted from THP-1 cells that were either unstimulated or treated for 40 min with 10 nM 1α,25(OH)2D3. (A) Peak counts (percentages in parenthesis) are given for locations in the unique and common categories. The ‘common’ category represents locations where both samples had an FDR <1% peak. Peaks were considered to be at the same location when the narrower peak overlapped the wider by >50%. (B) Distribution of VDR peaks into genomic elements. For clarity, only the most significant P-value from the binomial test is given for each element. Only P-values <0.005 are shown. (C) Distance to the TSS of the closest Ensembl transcript. The whole MACS peak set was divided into the indicated FDR ranges, unique and common peak locations were defined within each range and the densities of distances between each peak and the nearest TSS plotted by peak group and FDR range. Decrease in the density at 0 kb from high-confidence peaks (FDR <1%) to nearly random peaks (FDR >10%) indicates non-random proximity to TSS. Unstim, unstimulated.
Figure 2.
Figure 2.
De novo identified DR3-type REs. De novo analysis was performed on sequences ±100 bp of the FDR <1% VDR peak summits. (A) The consensus DR3-type RE identified by the rGADEM de novo search is displayed in comparison to the public RXRA::VDR heterodimer consensus sequence in the JASPAR database. Note that the de novo DR3-type RE allows more variability at certain positions than the JASPAR DR3-type sequence. (B) Correlation between the de novo DR3-type RE E-value and the peak FE. E-value describes how perfectly each individual element matches the common consensus (x-axis). For peaks with multiple de novo DR3-type REs, only the element with the lowest E-value was selected. The blue line indicates the linear fit with 95% confidence intervals in gray, with associated Pearson correlation r and P-values given in the upper left corner of the graph.
Figure 3.
Figure 3.
Ligand-dependent VDR occupation on the de novo DR3-type REs. The usage of the de novo DR3-type RE is strongly ligand dependent. (A) The running mean of the difference in peak FE at VDR binding locations (x-axis; 1α,25(OH)2D3 minus unstimulated, window size 50 locations) was plotted against the percentage of locations with the de novo DR3-type RE (y-axis). For unique peaks, the minimum FE of the whole 2340 peak set was used as the value for the ‘missing’ sample, to represent the lower detection limit. The inset shows 3 examples of peak pairs with different ligand effects on peak FE (a, decrease; b, no change; and c, increase). (B) The effect of the number of de novo DR3-type REs on the peak FE. Unstim, unstimulated.
Figure 4.
Figure 4.
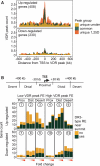
VDR peak height, location at <400 kb from the TSS, and the presence of de novo DR3-type REs predicts strong upregulation of 1α,25(OH)2D3 target genes. (A) Common and treatment-unique VDR binding sites in the neighborhoods of up- (upper panel) and downregulated genes (lower panel). (B) The diagram on top describes the distance categories used for selecting the most likely regulating VDR binding site as follows (distances not to scale). For each differentially expressed gene, the most likely regulating FDR <1% VDR peak was assumed to be the largest peak (by FE) that was within ±400 kb of the gene TSS. The most likely regulators were further divided into proximal and distal at ±30 kb to identify distance-related differences. If no peak was within ±400 kb, then the closest one of any FE was taken to represent a potential regulating site. See Supplementary Figure S3 for the basis of the selected distance limits. The bar graph below shows that the most likely gene regulatory VDR binding sites for up but not downregulated genes are enriched to within 400 kb of the target gene TSS and preferentially use DR3-type REs. Here, up- and downregulated genes were separately split by fold change into tertiles, indicated by increasing intensity of red in the triangle below the x-axis. Peaks were split into two equal sized halves by FE (left and right panels). Gene counts are plotted for up- (upper panel) and downregulated genes (lower panel). The gene counts are further split according to the presence or absence of a de novo DR3-type RE near the summit of the most likely regulating VDR peak, as indicated in the legend. The likely regulatory scenarios are indicated by the circled numbers 1–12, and used as peak labels in Figure 5 and Supplementary Figure S4. Unstim, unstimulated; Prox, proximal; Dist, distal.
Figure 5.
Figure 5.
VDR ChIP-seq analysis of genomic loci for the 1α,25(OH)2D3 target genes SP100, ELL and THBD. In (A–C), the peak tracks show the unstimulated and 1α,25(OH)2D3-treated VDR peaks. The high-confidence peaks are indicated as yellow-to-orange-to-red boxes, color scale signifying FE (yellow, low FE; red, high FE), below each peak track. DR3-type REs within ±100 bp of VDR peak summits are indicated by blue vertical lines below the ligand-treated VDR peak track. The gene structures are shown in blue at the bottom. Gene names in red color indicate upregulated genes (no downregulated genes were present in the loci shown). The red arrows above the peak tracks indicate the location of the manually validated VDR binding locations. The circled numbers above the VDR peaks indicate their category in reference to the underlined gene (see Figure 4B for details), plus symbol and minus symbol indicating the presence or absence of a DR3-type VDRE near the peak summit. Unstim, Unstimulated. (D). ChIP validation of VDR as well as RXR binding at sites indicated by the red arrows in A–C near the exemplary target genes SP100, ELL and THBD (bar graphs, mean ±SD), and the qPCR validation of their target gene status (box plots). The 40 min (ChIP) or 4 h (qPCR) experiments with unstimulated/vehicle (minus symbol) or 1α,25(OH)2D3 (plus symbol) treatments are indicated below the graphs.

Similar articles

Cited by

References

    1. Carlberg C, Polly P. Gene regulation by vitamin D3. Crit. Rev. Eukaryot. Gene Expr. 1998;8:19–42. - PubMed
    1. DeLuca HF. Overview of general physiologic features and functions of vitamin D. Am. J. Clin. Nutr. 2004;80:1689S–1696S. - PubMed
    1. Ingraham BA, Bragdon B, Nohe A. Molecular basis of the potential of vitamin D to prevent cancer. Curr. Med. Res. Opin. 2008;24:139–149. - PubMed
    1. Verstuyf A, Carmeliet G, Bouillon R, Mathieu C. Vitamin D: a pleiotropic hormone. Kidney Int. 2010;78:140–145. - PubMed
    1. Bouillon R, Carmeliet G, Verlinden L, van Etten E, Verstuyf A, Luderer HF, Lieben L, Mathieu C, Demay M. Vitamin D and human health: lessons from vitamin D receptor null mice. Endocr. Rev. 2008;29:726–776. - PMC - PubMed

Publication types

Associated data