. 2011 Aug 16;30(19):3895-912.
doi: 10.1038/emboj.2011.289.

Calcium microdomains at the immunological synapse: how ORAI channels, mitochondria and calcium pumps generate local calcium signals for efficient T-cell activation

Affiliations

Calcium microdomains at the immunological synapse: how ORAI channels, mitochondria and calcium pumps generate local calcium signals for efficient T-cell activation

Ariel Quintana et al. EMBO J. .

Abstract

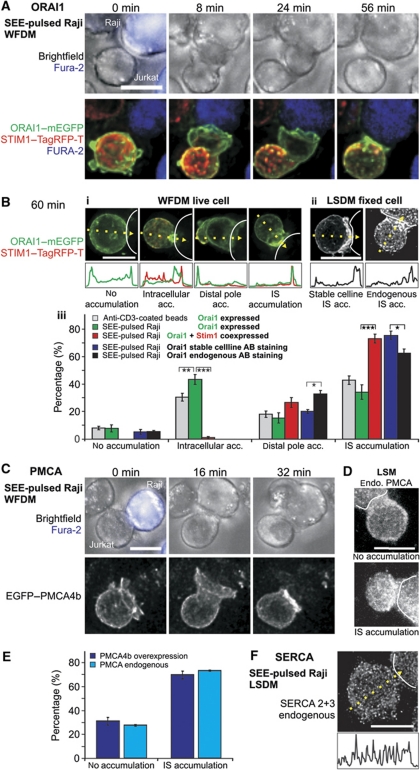
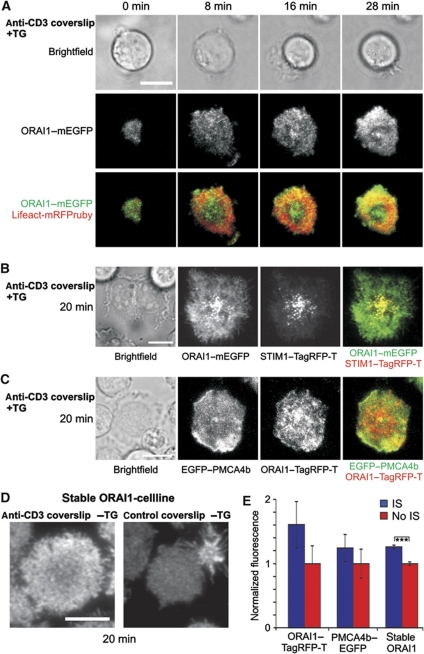
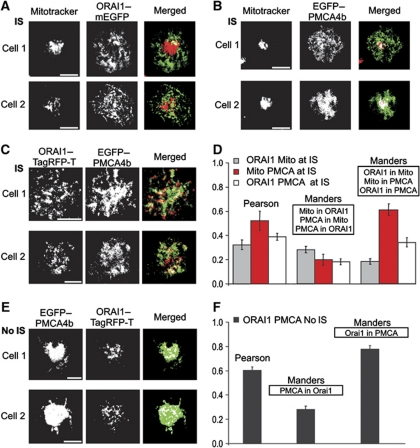
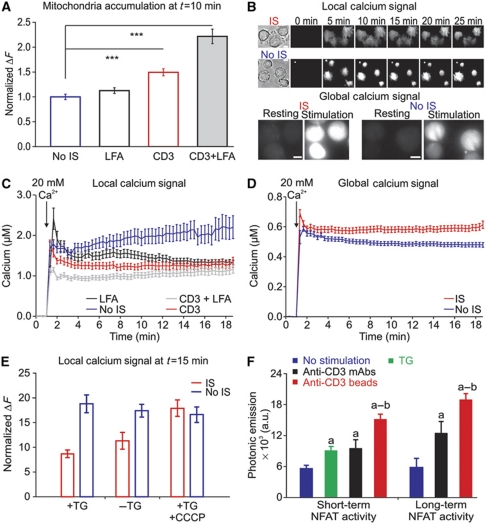
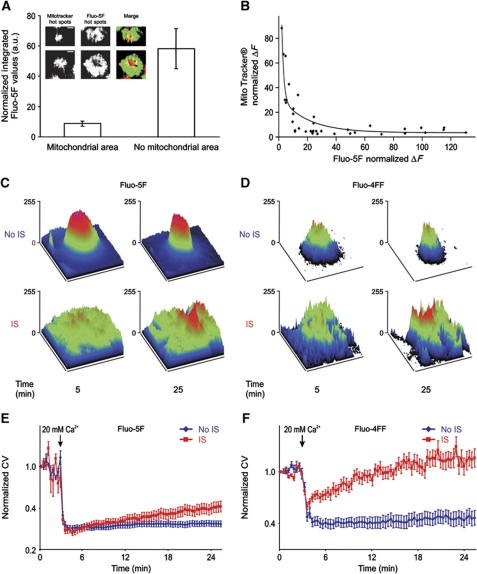
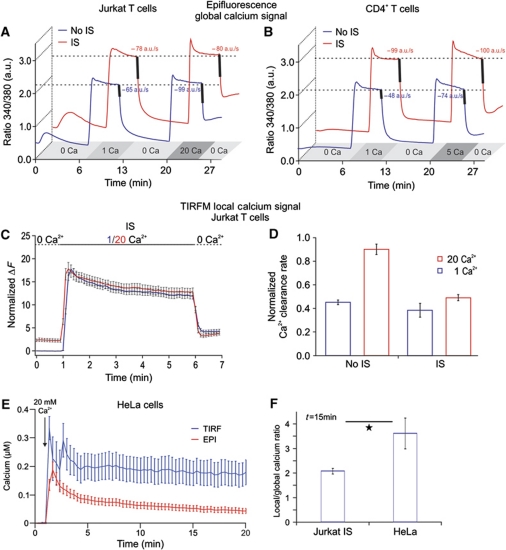
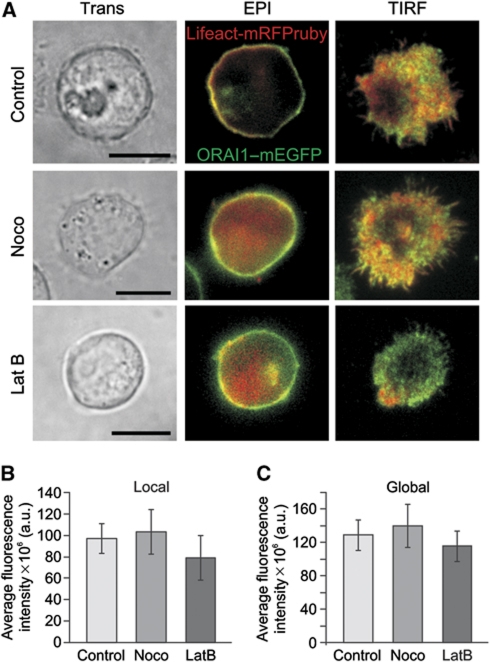
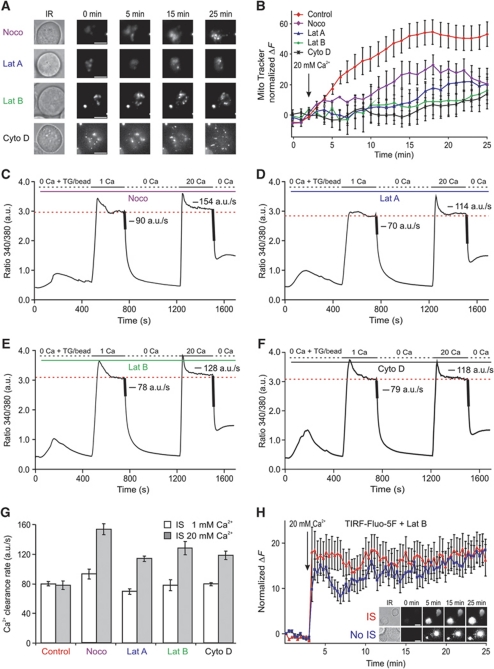
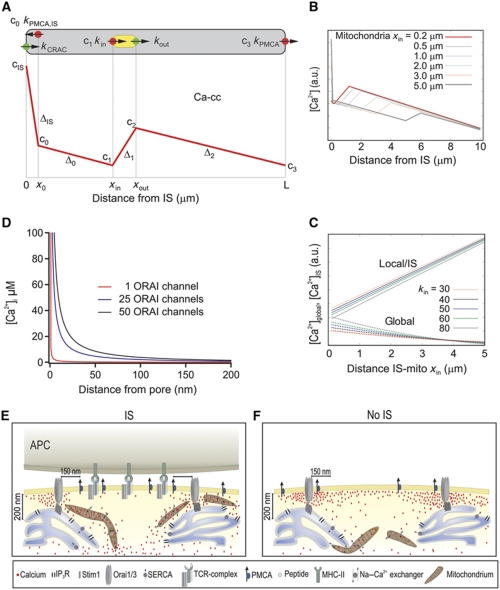
Cell polarization enables restriction of signalling into microdomains. Polarization of lymphocytes following formation of a mature immunological synapse (IS) is essential for calcium-dependent T-cell activation. Here, we analyse calcium microdomains at the IS with total internal reflection fluorescence microscopy. We find that the subplasmalemmal calcium signal following IS formation is sufficiently low to prevent calcium-dependent inactivation of ORAI channels. This is achieved by localizing mitochondria close to ORAI channels. Furthermore, we find that plasma membrane calcium ATPases (PMCAs) are re-distributed into areas beneath mitochondria, which prevented PMCA up-modulation and decreased calcium export locally. This nano-scale distribution-only induced following IS formation-maximizes the efficiency of calcium influx through ORAI channels while it decreases calcium clearance by PMCA, resulting in a more sustained NFAT activity and subsequent activation of T cells.


Conflict of interest statement

The authors declare that they have no conflict of interest.

Figures

Figure 1
Figure 1
STIM1, ORAI1 and PMCA4b localization at the IS. (A) Widefield deconvolution microscopy (WFDM) of an ORAI1–mEGFP (green) and STIM1–TagRFP-T (red) overexpressing Jurkat T cell contacting a SEE-pulsed Raji B cell, which was stained with fura-2/AM (blue) (see also Supplementary Movie S2). Displayed as XY maximum intensity projections (MIP), STIM1 co-accumulates with ORAI1 first in a cap-like structure distal to the contact point (IS) before being translocated together with ORAI1 to the IS. (B) Example of ORAI1 accumulation 60 min after contact with SEE-pulsed Raji cells (dotted lines). (i) Shown are four Jurkat T cells overexpressing ORAI1–mEGFP (green) and STIM1–TagRFP-T (red, the red channel overlaps with ORAI1 and is mostly visible as yellow, the cell with ‘no accumulation’ did not express STIM1). The line graphs depict fluorescence distribution in the yellow arrows. (ii) Examples of either ORAI1 stable expressing cells or endogenous antibody stained cells accumulating ORAI1 at the IS. (iii) Statistical analysis of ORAI1 accumulation phenotypes 60 min after contact with a SEE-pulsed Raji cell or an anti-CD3 antibody-coated bead (beads: N=13 experiments, n=234 cells; Raji: N=9, n=203; ORAI1+STIM1 Raji: N=6, n=109; stable: N=4, n=161; endogenous: N=3, n=91, stable/endogenous ORAI1 P (distal)=0.029, P (IS)=0.03). (C) Contact between an EGFP–PMCA4b expressing Jurkat T cell and a SEE-pulsed Raji B-cell (blue). PMCA4b is enriched at the IS after contact (see in the picture taken 32 min after contact). (D) Phenotype examples of fixed cells stained for endogenous PMCA. (E) Statistical analysis of living and fixed cells like the ones shown in (D, E) (live: N=11, n=76; fixed: N=3, n=91). (F) Example of a cell fixed and stained with an antibody against SERCA 2 and 3. Scale bars are 10 μm.
Figure 2
Figure 2
ORAI1, STIM1 and PMCA4b localization at the IS visualized with TIRFM. (A) TIRFM of an ORAI1–mEGFP and Lifeact-mRFPruby expressing Jurkat T cell stimulated with TG and settled on an anti-CD3 antibody-coated coverslip. Flattening of the cell and the ring-shaped actin accumulation (red) confirm formation of a stable IS. (B) TIRFM of an ORAI1–mEGFP and STIM1–TagRFP-T expressing Jurkat T cell stimulated with TG and settled on an anti-CD3 antibody-coated coverslip. (C) TIRFM of an EGFP–PMCA4b and ORAI1–TagRFP-T overexpressing Jurkat T cell stimulated with TG and settled on an anti-CD3 antibody-coated coverslip. (D) Phenotype examples of ORAI1 stable-expressing cells settled on either anti-CD3 or uncoated coverslips, fixed and stained with an antibody against ORAI1. (E) Statistical analysis of total ORAI1 or PMCA fluorescence from cells of (C, D) (ORAI1–TagRFP-T/PMCA4b–EGFP: n (IS)=29, n (No IS)=17; stable cell line n (IS)=136, n (No IS)=179, P=1.48 × 10⁻¹⁰). Scale bars are 10 μm.
Figure 3
Figure 3
Mitochondria co-localize with PMCA but not with ORAI channels at the IS. (A) MitoTracker® DeepRed and ORAI1–mEGFP fluorescence pictures obtained by TIRFM with their corresponding merged pictures of two single representative Jurkat T cells 20 min after the formation of the IS. White points in merged pictures represent co-localization areas between mitochondria (red) and ORAI1 (green). (B) Same as in (A) for Jurkat T cells transiently expressing EGFP–PMCA4b. (C) Same as in (A) for T cells transiently expressing EGFP–PMCA4b and ORAI1–TagRFP-T. Scale bars are 5 μm. (D) Statistical analysis of co-localization between mitochondria and ORAI1 (grey, n=20), mitochondria and PMCA (red, n=9), and ORAI1 and PMCA (white, n=13) at the IS. Errors bars indicate s.e.m. (E) EGFP–PMCA4b and ORAI1–TagRFP-T fluorescence pictures obtained by TIRFM with their corresponded merged pictures of two single Jurkat T cells 20 min after Ca2+ influx activated with TG only. Cells were transiently co-expressing EGFP–PMCA4b and ORAI1–TagRFP-T. White points in merged pictures represent co-localization areas between PMCA (green) and ORAI1 (red). (F) Co-localization analysis between PMCA and ORAI1 (from E).
Figure 4
Figure 4
Formation of the IS induces mitochondrial accumulation, low subplasma membrane but high global Ca2+ signals and results in a larger NFAT activity. (A) Normalized TIRFM Mitotracker® green fluorescence 10 min after 20 Ca2+ addition from cells settled on either uncoated (n=228), activating LFA-1 (n=149), CD3 (n=161) or activating LFA-1 plus CD3 (n=113) antibody-coated coverslips. (B) Brightfield images (before Ca2+ addition) and TIRFM pictures of Fluo-5F/AM-loaded Jurkat T cells that were settled on either anti-CD3 antibody-coated coverslips (IS, top panel) or uncoated coverslips (No IS, bottom panel). Ca2+ stores were depleted by 10 min TG pre-treatment. Three minutes after starting the acquisition, cells were exposed to 20 mM Ca2+ for the next 22 min. Epifluorescence microscopy pictures of Fluo-5F/AM-loaded Jurkat T cells that were settled on either anti-CD3 antibody-coated coverslips (IS, top panel) or uncoated coverslips (No IS, bottom panel). (C) Local Ca2+ response measured by TIRFM from cells settled on either uncoated or coated coverslips with LFA-1, CD3 or LFA-1 plus CD3 antibodies (No IS n=54, LFA n=59, CD3 n=28, CD3+LFA n=37). (D) Global Ca2+ responses from the same cells as in (C) (P=0.0036). (E) Mean normalized fluorescence ΔF=(100 × (FF0)/F0)) of Fluo-5F in TIRFM of Jurkat T cells upon IS (red columns) or No IS (blue columns) stimulation in the presence or absence of TG and in the presence of TG+CCCP as indicated (+TG n (IS)=33, +TG n (No IS)=37, P<0.0001; –TG n (IS)=64, −TG n (No IS)=40, P<0.0001, +TG +CCCP n (IS)=126, +TG +CCCP n (No IS)=99, P=0.5795). (F) Long-term measurements of NFAT activity in Jurkat T cells expressing luciferase under control of 3 × NFAT response elements treated with anti-CD3 antibody-coated beads, anti-CD3 antibodies, TG or untreated (no stimulation). Mean values of photonic emissions reflecting NFAT activity released at 14 (long-term activity) and 6 (short-term activity) hours were calculated after no treatment (no stimulation), anti-CD3 mAbs, anti-CD3 antibody-coated beads and TG (n=6 experiments; a=P<0.05 versus no stimulation; b=P<0.05 versus anti-CD3 mAbs). Errors bars indicate s.e.m. Scale bars are 5 μm.
Figure 5
Figure 5
Mitochondria at the IS reduce subplasma membrane Ca2+ signals and increases their heterogeneity. (A) Average of normalized integrated Fluo-5F values after 20 min of IS formation from intracellular areas at the IS where mitochondria either localize or do not localize (n=20 cells and 40 mitochondria spots, P<0.01). Insets show pictures of hot areas of MitoTracker® DeepRed and Fluo-5F fluorescence with the corresponding merged pictures of two single 5F/AM- MitoTracker® Green/AM co-loaded Jurkat T cells 20 min after IS formation on anti-CD3 antibody-coated coverslips in the presence of 20 mM [Ca2+]o solution. Hot areas are defined as the areas with the highest MitoTracker® DeepRed and Fluo-5F fluorescences. (B) Normalized MitoTracker® fluorescence in single cells as a function of normalized Fluo-5F fluorescence from the co-loaded cells analysed in (A). (C, D) Surface plots of subplasmalemmal Ca2+ signals from single representative Fluo-5F/AM (C) or Fluo-4FF/AM (D) -loaded T cells at 5 and 25 min after TG stimulation (top panel, No IS) or IS formation (bottom panel). (E, F) Average of normalized CV from Fluo-5F (E) and Fluo-4FF (F) fluorescence at subplasma membrane regions in T cells stimulated with TG (No IS, blue traces) or upon IS formation (red traces) over time (n=63, P<0.01; n=47, P<0.001). Errors bars indicate s.e.m. Scale bars are 5 μm.
Figure 6
Figure 6
Formation of the IS reduces Ca2+ microdomain-dependent modulation of PMCA activity in Jurkat T cells. (A) Average of [Ca2+]i responses of so-called iso-cells induced by 1 or 20 mM extracellular Ca2+ solutions in Jurkat T cells. The averages of Ca2+ clearance rates following [Ca2+]i elevation, indicated by the thick lines, were calculated from the dRatio (340/380)/dt slopes over 10 s periods following [Ca2+]o removal (n (No IS)=180, P<0.001; n (IS)=60, P=0.76). (B) Same experiments and analysis as in (A) only with human CD4+ T cells in the presence of 1 or 5 mM extracellular Ca2+ solutions to avoid saturation of the system (n (No IS)=253, P<0.001; n (IS)=176, P=0.6). (C, D) Same experimental design and analysis as in (A) only with TIRFM (n (IS)=18, n (No IS)=50). (E) Global (red trace) and local (blue trace) Ca2+ signals of Fluo-5F-loaded HeLa cells in response to TG stimulation in the presence of 20 mM extracellular Ca2+ solution. Global Ca2+ signals were measured by epifluorescence while local signals were obtained by TIRFM in the same cells. (F) Ratio between the local and global Ca2+ response at 15 min after stimulation with TG in HeLa cells or with TG plus IS in Jurkat T cells. HeLa data were obtained from two independent experiments (n=12, P=0.037). Jurkat T-cell data were taken from experiments shown in Figure 4C and D.
Figure 7
Figure 7
Cytoskeleton polymerization-disrupting drugs do not inhibit ORAI accumulation at the IS. (A) Transmission light (Trans), epifluorescence (Epi) and TIRFM pictures of representative single Jurkat T cells treated with cytoskeleton-disrupting drugs (2 μM nocodazole, 10 μg/ml latrunculin B). Cells were transiently expressing Lifeact-mRFPruby and ORAI1–mEGFP proteins. After treatment, T-cells were settled on anti-CD3 antibody-coated coverslips for 20–30 min in the presence of extracellular Ca2+ solution to induce the formation of a matured IS. Scale bars are 10 μm. Average intensity of the local (B) and global (C) fluorescence signal of ORAI1–mEGFP measured for cells pre-treated with nocodazole or latrunculin B or kept under control conditions (control n=32, nocodazole n=20, latrunculin B n=21).
Figure 8
Figure 8
Disruption of cytoskeleton-dependent mitochondrial translocation to the IS rescues the Ca2+ microdomain-dependent modulation of PMCA activity. (A) Brightfield images (before stimulation) and TIRFM images of single representative MitoTracker® Green/AM-loaded Jurkat T cells that were pre-treated with nocodazole (2 μM) latrunculin A (10 μg/ml), latrunculin B (10 μg/ml) or cytochalsin D (10 μM) as indicated in order to block the cytoskeleton-dependent mitochondrial translocation to the IS. Cells were settled on anti-CD3 antibody-coated coverslips (IS) for 5–7 min in a Ca2+-free solution to induce the maximal depletion of intracellular Ca2+ stores. Three minutes after starting the acquisition, cells were exposed to 20 mM Ca2+ for the next 22 min. The brightest point in the TIRFM picture belongs to a fluorescent bead (Invitrogen) used as control of the focus (see Materials and methods). (B) Statistical analysis of the normalized MitoTracker® fluorescence from 40 (Control, red trace), 10 (Noco, purple trace), 20 (Lat A, blue trace), 20 (Lat B, green trace) and 16 (Cyto D, black trace) cells analysed as the ones shown in (A) (Noco, Lat A, Lat B and Cyto D versus control at 20 min; P=0.079, P=0.041, P=0.029, P=0.028). (C, F) Average [Ca2+]i responses and Ca2+ clearance rates from control iso-cells induced by 1 or 20 mM extracellular Ca2+ solutions in the presence of nocodazole (C), latrunculin A (D), latrunculin B (E) and cytochalasin D (F) following IS formation. Average Ca2+ clearance rates following [Ca2+]i elevation (indicated by the thick lines) were calculated by the dRatio (340/380)/dt slopes over 10 s periods following external Ca2+ removal. (G) Statistical analysis of Ca2+ clearance rates from the cells shown in (C, F) compared with controls cells from Figure 6A (1 versus 20; control: n=60, P=0.76; Noco: n=14, P<0.0001; Lat A: n=20, P<0.0001; Lat B: n=15, P<0.001; Cyto D: n=12, P<0.0001). (H) Normalized Fluo-5F fluorescence from 15 (IS, red Δ) and 23 (No IS, blue □) cells, respectively (at 20 min, P=0.6). Inset shows brightfield images (before stimulation) and TIRFM pictures of Fluo-5F/AM-loaded Jurkat T cells. Cells were settled on either anti-CD3 antibody-coated coverslips (IS) or poly-L-ornithine-coated coverslips (No IS) in the absence of extracellular Ca2+ solution containing 1 μM TG for 5–7 min. Cells were pre-treated with latrunculin B (Lat B) as in (A). Three minutes after starting the acquisition, cells were exposed to 20 mM Ca2+ for the next 22 min. Errors bars indicate s.e.m. Scale bars are 5 μm.
Figure 9
Figure 9
Mathematical model for the spatial arrangement of CRAC channels, mitochondria and PMCAs and the dependence of Ca2+ concentrations on the distance between IS and mitochondria (A) Overview over the one-dimensional model: cytosol is grey, mitochondria are yellow, Ca2+ sources are green and Ca2+ sinks are red. The red curve represents the expected spatial profile of the cytosolic Ca2+ concentration. cIS is the concentration at the location of the CRAC channel (x=0), c0 ca. 100 nm away from the CRAC channel (at x0), c1 at the front end of the mitochondria (x=xin), c2 at the back end (x=xout) and c3 at the PMCA pumps away from the IS (x=L). The slopes of the linear parts are denoted as ΔIS, Δ0, Δ1 and Δ2 (see Supplementary data). (B) Stationary Ca2+ concentration cs(x) as a function of x for different positions xin of the mitochondria. The parameters are kCRAC=200/s, kin=60 μm/s, kPMCA=20 μm/s, kPMCAI,S=40 μm/s. Note that parameters and concentrations are given in one-dimensional units, the three-dimensional equivalent can be computed with formula 10 in the Supplementary data. (C) Comparison of the stationary local Ca2+ concentration at the IS, cIS (upper curves) and the average global Ca2+ concentrations cglobal (lower curves) as a function of the distance xin between IS and mitochondria for mitochondrial input rates kin. The parameters are kCRAC=200/s, kin=30–80 μm/s, kPMCA=20 μm/s, kPMCAI,S=40 μm/s. Note that parameters and concentrations are given in one-dimensional units, the three-dimensional equivalent can be computed with formula 10 in the Supplementary data. (D) Mathematical estimation of a Ca2+ microdomain near an open ORAI channel (red curve), and around 25 (blue curve) and 50 (black curve) ORAI channels. Single channel current was assumed to be 3.8 fA (Prakriya and Lewis, 2002, 2006; Prakriya et al, 2006). EGTA concentration was 1.2 mM, thus, the mean path length (λ) value was ∼400 nm. For channel clusters (∼60–100 nm wide; Park et al, 2009), which are small relative to λ, the clusters can be approximated by a single channel with the sum of all individual channels (Naraghi and Neher, 1997; Neher, 1998). Note that physiological activation of ORAI channels only occurs through the formation of channel clusters directly beneath STIM1 puncta. (E, F) Cartoons illustrate the physiological (IS) and non-physiological (No IS) activation of T cells. Following IS formation, mitochondria are quickly transported by the actin cytoskeleton (not shown for simplicity) to the IS in the immediate vicinity of ORAI channel clusters (∼200 nm away). This translocation allows them to prevent the slow Ca2+-dependent ORAI channel inactivation by reducing the magnitude and/or extension of Ca2+ microdomains and thereby sustaining the activity of ORAI channels. In addition, PMCA re-distribute into areas of the PM where mitochondria are present, which induces a significant reduction of local Ca2+ microdomain-dependent modulation of PMCA activity. The subcellular organelle distribution induces higher [Ca2+]i, which is translated into more sustained NFAT activity, more efficient T-cell activation and increased cell proliferation. In the absence of IS formation (i.e. TG stimulation), mitochondria do not approach subplasmalemmal areas (<200 nm) and PMCA are not re-distributed in the PM. Therefore, Ca2+ microdomains and subsequent subplasmalemmal Ca2+ signals are higher, which in turn induce the slow Ca2+-dependent ORAI channel inactivation.

Similar articles

Cited by

References

    1. Abarca-Rojano E, Muñiz-Hernández S, Moreno-Altamirano MM, Mondragón-Flores R, Enriquez-Rincón F, Sánchez-García FJ (2009) Re-organization of mitochondria at the NK cell immune synapse. Immunol Lett 122: 18–25 - PubMed
    1. Baixauli F, Martín-Cófreces NB, Morlino G, Carrasco YR, Calabia-Linares C, Veiga E, Serrador JM, Sánchez-Madrid F (2011) The mitochondrial fission factor dynamic-related protein 1 modulates T-cell receptor signalling at the immunological synapse. EMBO J 30: 1238–1250 - PMC - PubMed
    1. Bakowski D, Glitsch MD, Parekh AB (2001) An examination of the secretion-like coupling model for the activation of the Ca2+ release-activated Ca2+ current I(CRAC) in RBL-1 cells. J Physiol 532: 55–71 - PMC - PubMed
    1. Barr VA, Bernot KM, Srikanth S, Gwack Y, Balagopalan L, Regan CK, Helman DJ, Sommers CL, Oh-Hora M, Rao A, Samelson LE (2008) Dynamic movement of the calcium sensor STIM1 and the calcium channel Orai1 in activated T-cells: puncta and distal caps. Mol Biol Cell 19: 2802–2817 - PMC - PubMed
    1. Bauer MC, O’Connell D, Cahill DJ, Linse S (2008) Calmodulin binding to the polybasic C-termini of STIM proteins involved in store-operated calcium entry. Biochemistry 47: 6089–6091 - PubMed

Publication types