. 2011 Aug 16;30(20):4274-86.
doi: 10.1038/emboj.2011.281.

PIKE-mediated PI3-kinase activity is required for AMPA receptor surface expression

Affiliations

PIKE-mediated PI3-kinase activity is required for AMPA receptor surface expression

Chi Bun Chan et al. EMBO J. .

Abstract

AMPAR (α-amino-3-hydroxy-5-methyl-isoxazole-4-propionic acid receptor) is an ion channel involved in the formation of synaptic plasticity. However, the molecular mechanism that couples plasticity stimuli to the trafficking of postsynaptic AMPAR remains poorly understood. Here, we show that PIKE (phosphoinositide 3-kinase enhancer) GTPases regulate neuronal AMPAR activity by promoting GluA2/GRIP1 association. PIKE-L directly interacts with both GluA2 and GRIP1 and forms a tertiary complex upon glycine-induced NMDA receptor activation. PIKE-L is also essential for glycine-induced GluA2-associated PI3K activation. Genetic ablation of PIKE (PIKE(-/-)) in neurons suppresses GluA2-associated PI3K activation, therefore inhibiting the subsequent surface expression of GluA2 and the formation of long-term potentiation. Our findings suggest that PIKE-L is a critical factor in controlling synaptic AMPAR insertion.


Conflict of interest statement

The authors declare that they have no conflict of interest.

Figures

Figure 1
Figure 1
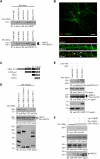
PIKE associates with GRIP1. (A) Y2H screening using PIKE-L GTPase domain as the bait. (B) Both PIKE-A and PIKE-L interact with GRIP1. HEK293 cells were co-transfected with myc–GRIP1 and various GFP-tagged PIKE-L or PIKE-A constructs. PIKE proteins were immunoprecipitated and the associated GRIP1 was detected (first panel). The expression of GFP proteins (second and third panels) and myc–GRIP1 was also examined (fourth panel). (C) PIKE-L associates with GRIP1 in neurons. Immunoprecipitation using various antibodies was performed as indicated in cultured cortical neurons (21 DIV) and the associated proteins were detected using specific antibody (top panel). Total GRIP1 (middle panel) was detected using antibody against GRIP1. Antibody against the C-terminus of PIKE-L (PIKE (C)) was used to determine the expression of PIKE-L (bottom panel). (D) PIKE-L associates with GRIP1 in rat brain. Immunoprecipitation using indicated antibody was performed in whole brain lysates and the associated PIKE-L was detected by antibody against the N-terminus of PIKE-L (PIKE (N)). (E) Co-localization of PIKE-L and GRIP1 in neurons. Immunofluorescent staining was performed on hippocampal neurons (21 DIV) using anti-PIKE-L C-terminus antibody (PIKE (C)) (green) and anti-GRIP1 antibody (red). Scale bar represents 20 μm. (F) Schematic representation of various GRIP1 deletion truncates used in the in vitro binding assay. (G) Mapping of PIKE-L interaction domain in GRIP1. Various deletion truncates of GRIP1 tagged with bacterial GST were purified and incubated with cell lysates from HEK293 cells expressing HA–PIKE-L. The GST proteins were pulled down and the associated PIKE-L was detected (upper panel). The expression of GST-tagged GRIP1 truncates (asterisked) was also examined (lower panel). (H) Schematic representation of various PIKE-L deletion truncates used in the in vitro binding assay. (I) Mapping of GRIP1 interaction domain in PIKE-L. Various deletion mutants of PIKE-L were expressed and purified from bacteria and incubated with cell lysates from HEK293 cells expressing myc–GRIP1. The GST proteins were pulled down and the associated PIKE-L was detected (upper panel). The expression of GST-tagged PIKE-L truncates (asterisked) was also examined (lower panel).
Figure 2
Figure 2
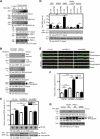
PIKE associates with GluA2. (A) Formation of PIKE-L/GRIP1/GluA2 complex in brain. Immunoprecipitation from whole rat brain lysates using various antibodies was performed and detected with either anti-GRIP1 antibody or antibody against the N-terminus of PIKE-L (PIKE (N)). (B) Co-localization of PIKE-L and GluA2 in neurons. Immunofluorescent staining was performed in hippocampal neurons (21 DIV) using anti-PIKE-L C-terminus antibody (PIKE (C)) (red) and anti-GluA2 antibody (green). Scale bar represents 20 μm. (C) Schematic representation of various PIKE-L deletion truncates used in the in vitro binding assay. (D) The PH domain of PIKE-L is essential for GluA2 interaction. HEK293 cells were transfected with HA–GluA2 and different deletion mutant of myc–PIKE-L. The PIKE-L truncates were immunoprecipitated and the associated GluA2 was detected (top panel). The expression of the GluA2 (middle panel) and PIKE-L (asterisked) (bottom panel) was also examined. (E) Inhibition of PIKE-L/GluA2 interaction by exogenous PIKE-L PH domain. Mouse brain lysates were first incubated with 50 μg recombinant GST protein or GST–PIKE-L PH domain (GST–PH) and the PIKE-L were then immunoprecipitated. The associated GluA2 was then detected (first panel). The expressions of GluA2 (second panel), PIKE-L (third panel) and the GST proteins (fourth and fifth panels) were also examined. (F) PIKE-L enhances GRIP1/GluA2 interaction. HEK293 cells were transfected with HA–GluA2, myc–GRIP1 and various amount of GFP–PIKE-L. Interaction of GRIP1 and GluA2 was detected using immunoprecipitation (first panel). The expression of GluA2 (second panel), GRIP1 (third panel) and PIKE-L (fourth panel) was also examined (bottom panel).
Figure 3
Figure 3
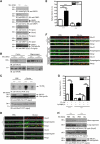
PIKE is essential for glycine-induced GluA2-associated PI3K activation and GluA2 surface expression in neurons. (A) Glycine stimulation enhances GluA2/GRIP1 association. Cortical neurons (10 DIV) were treated with glycine (200 μM) for indicated time intervals and the interactions between GRIP1, GluA2 and GRIP1 were determined by immunoprecipitation (first to third panels). The expressions of GluA2 (fourth panel), GRIP1 (fifth panel) and PIKE-L (anti-PIKE-L N-terminus antibody) (sixth panel) under glycine stimulation were also verified. (B) PI3K is critical for GluA2/GRIP1 interaction. Cortical neurons (10 DIV) were pretreated with LY294002 (10 μM) for 1 h followed by 20 min glycine (200 μM) stimulation. The interaction between GRIP1, GluA2 and PIKE-L was determined by immunoprecipitation (first and third panels). PIKE-L level was examined using anti-PIKE-L N-terminus antibody (PIKE (N)) (fifth panel). The expressions of GRIP1 (third panel) and GluA2 (sixth panel) was also verified. (C) PIKE-L facilitates glycine-induced GluA2-associated PI3K activation. Cortical neurons (10 DIV) were infected with control adenovirus (Ctr Ad), adenovirus carrying PIKE-L (Ad-PIKE-L) or adenovirus carrying shRNA against PIKE-L (Ad-shPIKE). After 48 h infections, the neurons were treated with glycine (200 μM) and GluA2 was then immunoprecipitated. The activity of PI3K associated with GluA2 was examined by in vitro PI3K assay. Quantitation of 32P-PIP3 (middle panel) as a representation of PI3K activity was shown (top panel) and the expression of PIKE-L under various adenovirus infections was examined (bottom panel). Results were expressed as mean±s.e.m. (**P<0.01, Student's t-test, n=3). (D) Total PI3K activity could not be enhanced by glycine stimulation. Cortical neurons (10 DIV) were infected with either control adenovirus (Ctr Ad) or adenovirus carrying shRNA against PIKE-L (Ad-shPIKE). After 48 h infection, the neurons were treated with glycine (200 μM) and the total PI3K was then immunoprecipitated and analysed directly by in vitro PI3K assay (top panel). Phosphorylation of Akt was also examined using immunoblotting (middle panel). Total Akt was checked to ensure equal loading (bottom panel) (*P<0.05; **P<0.01; ***P<0.001, Student's t-test, n=3). (E) Overexpression of PIKE-L facilitates glycine-induced cell-surface expression of GluA2 in neurons. Hippocampal neurons (21 DIV) were infected with control adenovirus (Ctr Ad, left panels), adenovirus carrying PIKE-L (Ad-PIKE-L, middle panels) or adenovirus carrying shRNA against PIKE-L (Ad-shPIKE, right panels). After 48 h infection, the neurons were treated with glycine (200 μM), stained with anti-GluA2 antibody under non-permeabilized condition and the cell surface GluA2 were visualized by confocal microscope. (F) Quantitation of cell surface GluA2 on neurons shown in (D) (**P<0.01, ***P<0.001, Student's t-test, n=8). Arbitrary units (A.U.) of GluA2 expression were shown. (G) Biotinylation assay on cell-surface expression of GluA2. Cortical neurons (DIV 10) were infected with control adenovirus (Ctr Ad), adenovirus carrying PIKE-L (Ad-PIKE-L) or adenovirus carrying shRNA against PIKE-L (Ad-shPIKE) for 48 h before glycine (200 μM) treatment. Cell-surface proteins were biotinylated and pulled down by NeutrAvidin beads and the amount of GluA2 was detected using immunoblotting analysis (top panel). The expression of PIKE-L (middle panel) was determined using anti-PIKE-L N-terminus antibody (PIKE (N)). GluA2 level (bottom panel) after adenovirus infection was also examined.
Figure 4
Figure 4
Glycine-induced cell-surface expression of GluA2 is impaired in PIKE−/− neurons. (A) The association of GluA2 and GRIP1 is reduced in PIKE−/− brain. Immunoprecipitations from WT (+/+) and PIKE knockout (−/−) mouse brain lysates using control IgG (first panel), anti-PIKE-L C-terminal antibody (PIKE (C)) (second panel) and anti-GluA2 (third panel) were performed and the associated GRIP1 was detected using anti-GRIP1 antibody. The expression of GluA1 (fourth panel), GluA2 (fifth panel) and GRIP1 (sixth panel). The level of PIKE-L (seventh panel) was also examined using anti-PIKE-L N-terminus (PIKE (N)) antibody. (B) Surface expression of GluA2 is reduced in PIKE−/− brain. Plasma membrane were isolated from the cortex and hippocampus of age-matched (3-month-old) WT (+/+) and PIKE−/− (−/−) mice. The expression of GluA2 was determined by immunoblotting analysis (upper panel). Expression of EPO receptor was also determined as a loading control (lower panel). (C) Glycine-induced GluA2-associated PI3K activity is abolished in PIKE−/− neurons. After treated with glycine (200 μM), the GluA2 in WT (+/+) and PIKE-knockout (−/−) cortical neurons (10 DIV) was immunoprecipitated for PI3K assay (top panel). The expression of PIKE-L (middle panel) and GluA2 (bottom panel) in the cortical neurons were verified using anti-PIKE-L N-terminus (PIKE (N)) antibody and anti-GluA2, respectively. (D) Cell-surface expression of GluA2 under glycine treatment is impaired in PIKE−/− neurons. Hippocampal neurons (21 DIV) were stained with anti-GluA2 antibody under non-permeabilized condition and the cell surface GluA2 were visualized by confocal microscope. (E) Quantitation of cell surface GluA2 on neurons shown in (C) (***P<0.001, Student's t-test, n=8). Arbitrary units (A.U.) of GluA2 expression were shown. (F) Cell-surface expression of GluA2 is rescued in PIKE−/− neurons after PIKE-L overexpression. Hippocampal neurons (21 DIV) were infected with control adenovirus (Ctr Ad) or adenovirus overexpressing PIKE-L (AD-PIKE-L) for 48 h. The cells were then stimulated with PBS or glycine (200 μM, 20 min) and stained with anti-GluA2 antibody under non-permeabilized condition. (G) Quantitation of cell surface GluA2 on neurons shown in (F) (**P<0.01, Student's t-test, n=8). Arbitrary units (A.U.) of GluA2 expression were shown. (H) Biotinylation assay on cell-surface expression of GluA2. Cortical neurons (DIV 10) from WT (+/+) and PIKE knockout (−/−) mice were treated with glycine (200 μM). Cell-surface proteins were biotinylated, pulled down by NeutrAvidin beads and the amount of GluA2 was detected using immunoblotting analysis (top panel). The expressions of GluA2 (middle panel) and PIKE-L (bottom panel) were also examined using anti-PIKE-L N-terminus (PIKE (N)) antibody and anti-GluA2, respectively.
Figure 5
Figure 5
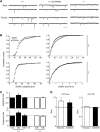
AMPA receptor-mediated synaptic transmission is impaired in PIKE−/− mice. (A) Reduced basal synaptic transmission in PIKE−/− hippocampus. The slopes of fEPSP were plotted against stimulus intensity. The insets show sample traces of fEPSPs at different stimulus intensity. Scale bars are 1 mV and 5 ms (nine slices from four WT mice (○) and seven slices from three PIKE−/− (•) mice, *P<0.05, **P<0.01 versus different genotypes under the same stimulation, Student's t-test). (B) Sample traces of mEPSC recording from CA1 neurons in whole-cell recording configuration. Scale bars are 20 pA and 100 ms. (C) Cumulative distribution for mEPSC amplitudes in WT (○) and PIKE−/− (•) neurons (WT, 24.2±1.3; PIKE−/−, 18.0±1.1 pA; n=8 cells from three WT and PIKE−/− mice, 4- to 6-week-old, **P<0.01, Student's t-test). (D) Cumulative distribution for mEPSC interevent intervals in WT (○) and PIKE−/− neurons (•) (WT, 7.6±0.5; PIKE−/−, 5.4±0.5 Hz; n=8 cells from three WT and PIKE−/− mice, 4- to 6-week-old, *P<0.05, Student's t-test). (E) Normal paired-pulse facilitation ratio in PIKE−/− SC-CA1 synapses. The insets show sample traces of fEPSPs at paired stimulation in 20 ms interval. Scale bars are 1 mV and 10 ms (nine slices from four WT mice (○) and seven slices from three PIKE−/− mice (•)). No statistically significant differences were detected in all conditions. (F) Representative overlays of NMDAR and AMPAR-evoked EPSCs from WT (top) and PIKE−/− (bottom) slices. NMDA-EPSC traces was obtained by subtracting the traces obtained in the presence of 100 μM DL-AP5 at +40 mV from those obtained before. The isolated AMPA-EPSC was measured at −60 mV in the presence of 100 μM DL-AP5. Scale bars represent 100 pA and 50 ms. (G) AMPA-EPSCs but not NMDA-EPSCs were reduced in PIKE−/− mice when compared with the WT mice (n=8 cells from three WT mice and n=9 cells from three PIKE−/− mice, *P<0.05, Student's t-test versus different genotypes). (H) AMPA/NMDA ratio (peak IAMPA/PEAK INMDA) is reduced in PIKE−/− mice (n=8 cells from three WT mice and n=9 cells from three PIKE−/− mice, *P<0.05, Student's t-test versus different genotypes). (I) TBS-induced LTP at SC-CA1 synapses was impaired in hippocampal slices of PIKE−/− mice (five slices from three WT mice (○) and six slices from three PIKE−/− mice (•)). (J) Reduced HFS-stimulated LTP in hippocampal slices of PIKE−/− mice. LTP at SC-CA1 synapses was induced by two trains HFS (five slices from three WT mice (○) and six slices from three PIKE−/− mice (•)).
Figure 6
Figure 6
Glycine-induced LTP induction is impaired in PIKE−/− hippocampal neurons. (A) Representative recordings from individual cultured neurons immediately before (Basal) and 20 min after glycine (200 μM) application. Middle traces were recorded from cultured hippocampal neurons that were treated with 10 μM LY294002 for 30 min prior to the application of glycine. Scale bars are 20 pA and 200 ms. (B) Cumulative distributions of mEPSC amplitudes and interevent intervals before (○) and 20 min after glycine (•). (C) Summary of data in (A, B). Responses obtained 20 min after glycine (Gly) treatment or LY294002 pretreatment (Ly) were normalized to the values from the initial 3 min (Con) of recording. Application of glycine in the bath solution induces LTP of mEPSC (1.24±0.05 and 1.28±0.06 for amplitude and frequency, respectively; n=8). Glycine produced LTP, which is prevented by inhibition of PI3K with LY294002 (1.01±0.03 and 1. 0±0.08 for amplitude and frequency, respectively; n=5) or in PIKE−/− cultured hippocampal neurons (0.99±0.06 and 0.95±0.06 for amplitude and frequency, respectively; n=6). Data were normalized by values before glycine application (*P<0.05, Student's t-test). (D) Inhibition of glycine-enhanced mEPSCs by PIKE-L PH domain. Neurons were recorded with pipette filled with solution containing 5 μg/ml GST (1.22±0.06 and 1.31±0.11 for amplitude and frequency, respectively; n=6) or GST-tagged PIKE-L PH domain (GST–PH; 1.03±0.03 and 0.99±0.02 for amplitude and frequency, respectively; n=5). Data were normalized by values before glycine application (*P<0.05, Student's t-test).
Figure 7
Figure 7
Proposed functions of PIKE-L during LTP formation. PIKE-L complexes with GRIP1 under basal condition at the excitatory synapses. During NMDAR-dependent LTP (e.g. TBS or glycine stimulation), the activation of NMDAR triggers the GluA2-associated PI3K activation. The newly formed PIP3 serves as a signal for the tethering of PIKE-L/GRIP1 complex to the GluA2 of the intracellular pool, where PIKE-L sustains the activity of GluA2-associated PI3K. The PIKE-L/GRIP1/GluA2 complex will then be transported to the synaptic surface, where the GRIP1 promotes the anchorage of GluA2 on the cell surface to facilitate the formation of LTP.

Similar articles

Cited by

References

    1. Ahn JY, Rong R, Kroll TG, Van Meir EG, Snyder SH, Ye K (2004) PIKE (phosphatidylinositol 3-kinase enhancer)-A GTPase stimulates Akt activity and mediates cellular invasion. J Biol Chem 279: 16441–16451 - PubMed
    1. Arendt KL, Royo M, Fernandez-Monreal M, Knafo S, Petrok CN, Martens JR, Esteban JA (2010) PIP3 controls synaptic function by maintaining AMPA receptor clustering at the postsynaptic membrane. Nat Neurosci 13: 36–44 - PMC - PubMed
    1. Bliss TV, Collingridge GL (1993) A synaptic model of memory: long-term potentiation in the hippocampus. Nature 361: 31–39 - PubMed
    1. Burnashev N, Monyer H, Seeburg PH, Sakmann B (1992) Divalent ion permeability of AMPA receptor channels is dominated by the edited form of a single subunit. Neuron 8: 189–198 - PubMed
    1. Capocchi G, Zampolini M, Larson J (1992) Theta burst stimulation is optimal for induction of LTP at both apical and basal dendritic synapses on hippocampal CA1 neurons. Brain Res 591: 332–336 - PubMed

Publication types

MeSH terms