. 2011 Aug 16:2:430.
doi: 10.1038/ncomms1444.

A CLASP-modulated cell edge barrier mechanism drives cell-wide cortical microtubule organization in Arabidopsis

Affiliations

A CLASP-modulated cell edge barrier mechanism drives cell-wide cortical microtubule organization in Arabidopsis

Chris Ambrose et al. Nat Commun. .

Abstract

It is well known that the parallel order of microtubules in the plant cell cortex defines the direction of cell expansion, yet it remains unclear how microtubule orientation is controlled, especially on a cell-wide basis. Here we show through 4D imaging and computational modelling that plant cell polyhedral geometry provides spatial input that determines array orientation and heterogeneity. Microtubules depolymerize when encountering sharp cell edges head-on, whereas those oriented parallel to those sharp edges remain. Edge-induced microtubule depolymerization, however, is overcome by the microtubule-associated protein CLASP, which accumulates at specific cell edges, enables microtubule growth around sharp edges and promotes formation of microtubule bundles that span adjacent cell faces. By computationally modelling dynamic 'microtubules on a cube' with edges differentially permissive to microtubule passage, we show that the CLASP-edge complex is a 'tuneable' microtubule organizer, with the inherent flexibility to generate the numerous cortical array patterns observed in nature.


Figures

Figure 1
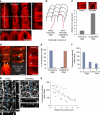
Figure 1. CLASP protein accumulates at cell edges in unexpanded cells.
(a) Schematic of edge and face nomenclature. Cell faces indicated in red text, cell edges in black text. L, longitudinal; P, periclinal; R, radial; T, transverse. (b) Root cells showing differential cell edge accumulation of GFP–CLASP at three different stages: recently divided, expanding, and preprophase cells. Cells are shown as maximum Z projections, and orthogonal views, and are accompanied by reference schematics (MTs, blue lines; GFP–CLASP, green). (c) Root tip cells exhibit strong GFP–CLASP expression and show non-uniform accumulation of GFP–CLASP around the cell edges. Shown is a confocal Z-projection through the outer half of the lateral root cap cells covering the root division zone. Arrows indicate GFP–CLASP enrichment at the shared wall between recently divided cells. Brackets indicate two adjacent cells. Dotted lines indicate GFP–CLASP enrichment along longitudinal edges of expanding cells. Bottom panel shows an X-orthogonal view through a GFP–CLASP expressing root tip. Arrows indicate GFP–CLASP on longitudinal edges. Brackets indicate enrichment covering the entire radial cell faces in smaller cells, in contrast to the edge-specific accumulation in larger cells. (d) Unexpanded leaf epidermal cells. Brackets indicate domains of GFP–CLASP accumulation at newly formed cross-walls. Image is a maximum Z-projection of a confocal stack from the leaf surface into the epidermal midplane. (e) Cell from inset in (d) showing single optical planes at three depths, and max Z projection. Brackets indicate GFP–CLASP edge domains. Arrows indicate MT lattice labelling on periclinal face. (f) Examples of strong GFP–CLASP enrichment at recently formed cross-walls of leaf epidermal cells. Single optical sections at the outer face and cellular midplane. Brackets indicate GFP–CLASP edge domains. The scale bars represent 5 μm.
Figure 2
Figure 2. Transfacial MT bundles intersect GFP–CLASP edge domains.
(a) A GFP–CLASP-expressing division zone cell (with transverse MTs) fixed and mounted (see Methods) such that it is viewed through the top-bottom axis. Arrowheads indicate GFP–CLASP edge domains. Co-staining with anti-tubulin (MTs, red) shows uniform MT distribution around the cell sides. Reference schematic depicts MTs in red, CLASP in green. (b) Transfacial MT bundles (TBs) intersect cell edges at GFP–CLASP domains. Maximum 3D reconstructions at 0 and 30 degrees (X-axis) enable simultaneous viewing of transverse and periclinal faces. Shown is a UBQ1:RFP–TUB6 (red) and GFP–CLASP (green) coexpressing root meristematic cell. (c) Codistribution of UBQ1:RFP–TUB6 (red) and GFP–CLASP (green) in young root and leaf cells. Symbols indicate various sizes of TB/GFP–CLASP edge intersections (Arrowheads=single MTs/small bundles; arrows=single moderate bundles; brackets=convergence of multiple bundles at intense GFP–CLASP domains; circles=passage of longitudinal TBs around rounded region of transverse edge, and associated lack of noticeable GFP–CLASP signal). The top panel shows cells from the division zone, middle panel shows a cell from the early elongation zone, bottom panel shows an unexpanded leaf cell. In the leaf images, the large TBs appear oversaturated due to the strong contrasting required to reveal the smaller TBs against the background of autofluorescent vacuolar anthocyanins. The scale bars represent 5 μm.
Figure 3
Figure 3. CLASP is enriched at select sharp edges.
(a) Wild-type root epidermal division zone cells visualized using RFP–TUB6. Shown are the outer periclinal cell faces (single optical section), and X and Y orthogonal views corresponding to the cross. (b) Schematic of cells in (a), depicting sharp transverse edges, and semi-rounded longitudinal edges. (c) Measurements of radius of curvature for wild-type root epidermal division zone cells. Data are taken from 85 wild-type cells, measuring 165 transverse edges, and 154 longitudinal edges. Data are means±s.e.m. (d) Wild-type root epidermal division zone cells coexpressing GFP–CLASP and RFP–TUB6. Single optical plane, X and Y orthogonal views are shown. Arrows indicate GFP–CLASP transverse edge accumulation. (e) Percentage of TBs intersecting GFP–CLASP edge domains in root epidermal division zone cells, comparing TBs that cross sharp (transverse) edges with semirounded (longitudinal) edges. Blue bars indicate TBs intersecting GFP–CLASP domains, red bars indicate TBs not intersecting GFP–CLASP edge domains (n=42 cells, 241 sharp edge TBs, 129 round edge TBs). (f) GFP–CLASP is enriched at transverse edges in root epidermal division zone cells. Single pixel intensity values at GFP–CLASP maxima (n=88 transverse edges, 87 longitudinal edges). T=transverse edge; L=Longitudinal edge; P=outer periclinal face. (g,h) GFP–CLASP enrichment at sharp edges correlates with edge curvature in variable curvature leaf epidermal cells. (g) Young and expanding cells shown in max Z projection and X and Y orthogonal views. Young cells contain sharper edges than expanding cells. (h) GFP–CLASP edge signal intensity correlates inversely with radius of curvature. (n=36 cells). The scale bars represent 5 μm.
Figure 4
Figure 4. MTs orient parallel to sharp edges in the absence of CLASP.
(a) Root tip epidermal cells from division zone (DZ) and early elongation zone (EZ) in wild type and clasp-1 mutants. Images are single optical sections. MTs are visualized using anti-tubulin immunofluorescence. We excluded the possibility that the lack of observable CTBs in clasp-1 is due to mistaking elongating cells from true division zone cells in clasp-1, which contains smaller meristems. Examining MT patterns in 384 cells from 13 clasp-1 roots (a sample size sufficient to capture all cell cycle stages) failed to show any incidence of TBs at transverse edges and very few non-transverse arrays. (b) Quantification of MT angles relative to sharp (transverse) edges in wild-type (blue bars) and clasp-1 (red bars) root epidermal division zone cells. (n=40 cells, 200 MTs). (c) Quantification of relative abundance of MT arrays according to orientation in division zones of wild-type (blue bars) and clasp-1 (red bars) roots. Arrays were labelled using anti-tubulin immunofluorescence and classified cell by cell as transverse (T), mixed (M), and longitudinal (L). For clasp-1, n=384 cells, 13 roots. For wild type, n=306 cells, 11 roots. Data are mean percentages±s.e. (d) Young leaf epidermal cells of wild type and clasp-1. Shown are Z-projections that extend into the cell midplane. MTs were visualized using GFP–MBD. Brackets indicate TBs in insets. Lines indicate orthogonal views. (e,f) Leaf epidermal cells from wild type and clasp-1. Shown for each are single optical planes, and orthogonal views (indicated by dotted lines). (e) Wild type. Arrows indicate TBs intersecting at right angles in wild type. (f) clasp-1. Cell indicated by white dotted outline. Double arrows indicate MT orientation. The scale bars represent 5 μm.
Figure 5
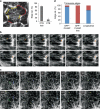
Figure 5. Sharp edges induce MT catastrophe and buckling.
(a) Time series from wild-type early elongating petiole cells. The time sequence is taken from the boxed region in the bottom right panel CTB-free cell ends characteristic of elongating cells with transverse arrays. Dots indicate MT plus-ends, dotted lines indicate cell edges. Arrows indicate directionality of growth or shortening in each case. Orthogonal view corresponds to the blue dotted line, and illustrates degree of edge curvature. (b) MT buckling on edge encounter in a wild-type leaf epidermal cell. Asterisk indicates initial edge encounter. (c) MT buckling on edge encounter in a clasp-1 leaf epidermal cell. Asterisk denotes initial edge encounter. The MT is released near the end of the sequence. The scale bars represent 5 μm. Times are in seconds.
Figure 6
Figure 6. CLASP mitigates the barrier effect of sharp cell edges.
(a) Percentage of MTs that undergo catastrophe on encounter of CTB versus CTB-free cell edges in young leaf epidermal cells. (n=38 cells, 172 MTs; bars are mean percentages±s.e). Yellow brackets indicate CTBs, Red lines indicate CTB-free domains (using CTBs as proxies for GFP–CLASP domains.) (b) MT persistence on encountering a CTB cell edge domain in a wild-type cotyledon epidermal cell. (c) MTs in clasp-1 mutants undergo catastrophe on reaching cell edges, which lack CTBs. Shown are cotyledon epidermal cells. The scale bars represent 5 μm. Times are in seconds. (d) MT-edge catastrophe rates at GFP–CLASP-containing versus GFP–CLASP-free domains at the transverse and longitudinal edges of root epidermal division zone cells. Red indicates MT edge catastrophe, blue indicates MT edge passage (n=27 cells, 154 MTs).
Figure 7
Figure 7. Simulations of cortical MTs on a cube.
These simulations use dynamic instability parameters measured from wild-type elongating cells at 21 °C reported in ref. and a nucleation rate of 5 μm−2 min−1. For all simulations, cells are shown schematically as 10×10 μm cubes, flattened cubes, and flattened cubes with MTs. Green edges represent CLASP domains, and have a low probability of edge-induced catastrophe. Golden edges represent low-curvature edges that also have low catastrophe (pcat=0.26). Non-coloured edges have a default high probability of inducing MT catastrophe. Transverse MTs (0–45°) are coloured light blue, and longitudinal MTs (45–90°) are coloured dark blue. For cell faces, T=transverse, R=radial, P=periclinal. For cell edges, T=Transverse, L=Longitudinal, R=Radial. See Supplementary Table S1 for edge catastrophe values. (a) Elongating or clasp-1 cells with transverse MT arrays are simulated by allowing MT passage on longitudinal edges only. (b) Recently divided cells with mixed MTs are simulated by decreasing the probability of edge-induced catastrophe specifically on the transverse edges, which is where CLASP protein is found. (c) Cells evocative of leaf epidermal cells or cells containing a PPB are simulated by allowing MTs to traverse the middle third of longitudinal edges (green). For simulating a PPB, red sectors highlight the possible sites of a hypothetical edge-based catastrophe factor.

References

    1. Flanders D. J., Rawlins D. J., Shaw P. J. & Lloyd C. W. Computer-Aided 3-D Reconstruction of Interphase Microtubules in Epidermal-Cells of Datura-Stramonium Reveals Principles of Array Assembly. Development 106, 531–541 (1989).
    1. Shaw S. L., Kamyar R. & Ehrhardt D. W. Sustained microtubule treadmilling in Arabidopsis cortical arrays. Science 300, 1715–1718 (2003). - PubMed
    1. Wasteneys G. O. & Collings D. A. C. The cytoskeleton and co-ordination of directional expansion in a multicellular context: in The Expanding Cell, Vol 5 (eds Verbelen, J.P. & Vissenberg, K.) 217–248 (Springer-Verlag, 2007).
    1. Ehrhardt D. W. Straighten up and fly right: microtubule dynamics and organization of non-centrosomal arrays in higher plants. Curr. Opin. Cell Biol. 20, 107–116 (2008). - PubMed
    1. Wasteneys G. O. & Ambrose J. C. Spatial organization of plant cortical microtubules: close encounters of the 2D kind. Trends Cell Biol. 19, 62–71 (2009). - PubMed

Publication types

MeSH terms

Substances