. 2011 Jul 28:5:32.
doi: 10.3389/fnint.2011.00032. eCollection 2011.

Neural underpinnings of distortions in the experience of time across senses

Affiliations

Neural underpinnings of distortions in the experience of time across senses

Deborah L Harrington et al. Front Integr Neurosci. .

Abstract

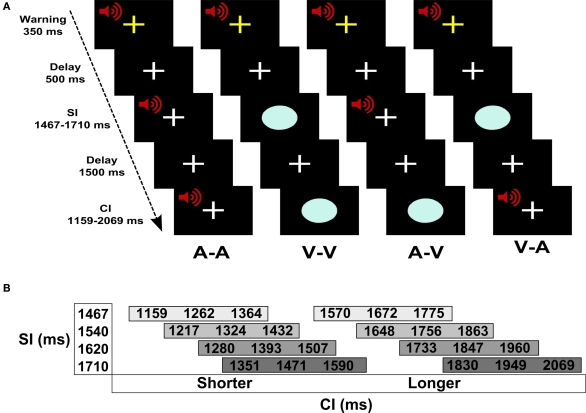
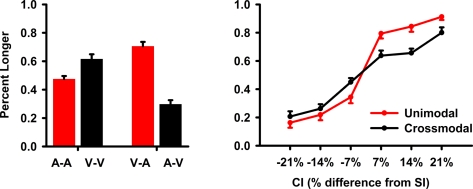
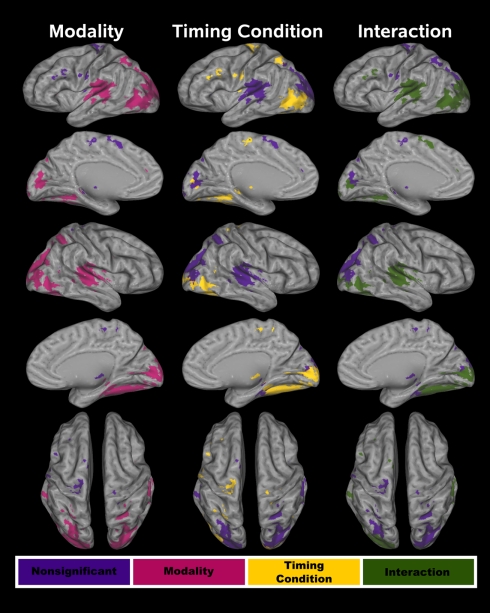
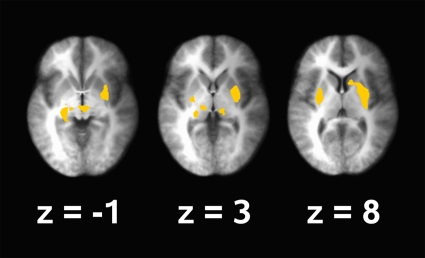
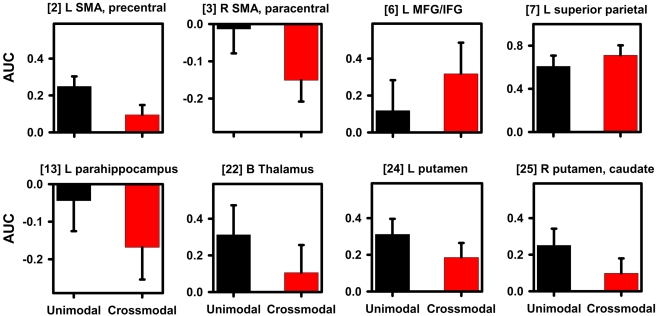
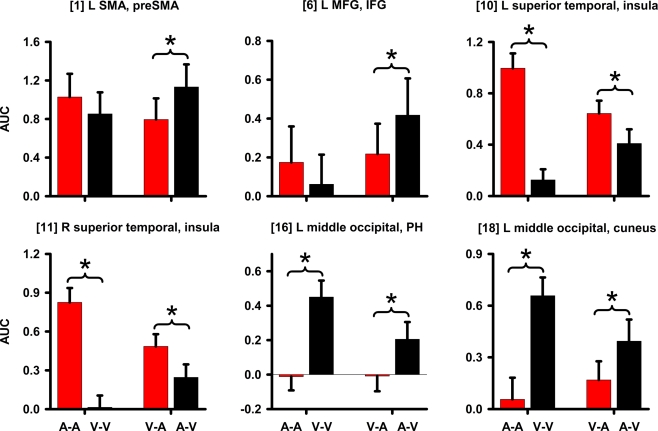
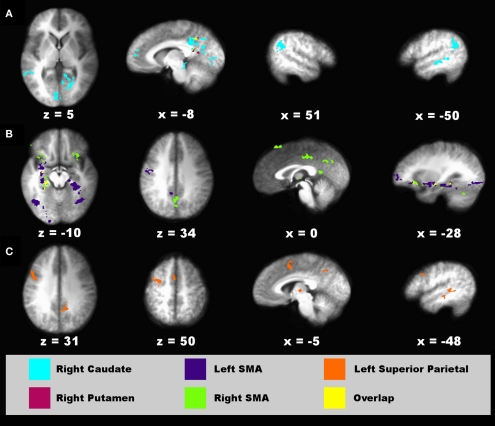
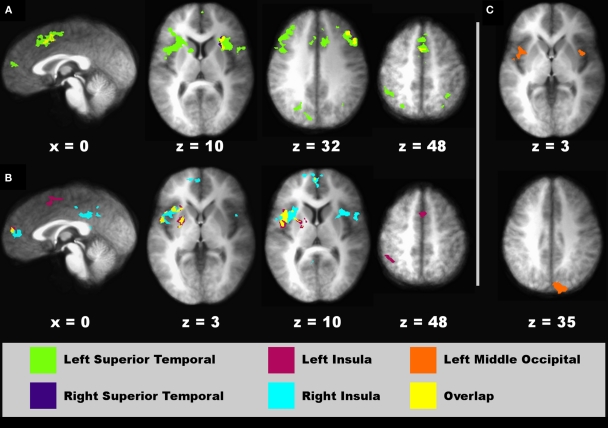
Auditory signals (A) are perceived as lasting longer than visual signals (V) of the same physical duration when they are compared together. Despite considerable debate about how this illusion arises psychologically, the neural underpinnings have not been studied. We used functional magnetic resonance imaging (fMRI) to investigate the neural bases of audiovisual temporal distortions and more generally, intersensory timing. Adults underwent fMRI while judging the relative duration of successively presented standard interval-comparison interval (CI) pairs, which were unimodal (A-A, V-V) or crossmodal (V-A, A-V). Mechanisms of time dilation and compression were identified by comparing the two crossmodal pairs. Mechanisms of intersensory timing were identified by comparing the unimodal and crossmodal conditions. The behavioral results showed that auditory CIs were perceived as lasting longer than visual CIs. There were three novel fMRI results. First, time dilation and compression were distinguished by differential activation of higher-sensory areas (superior temporal, posterior insula, middle occipital), which typically showed stronger effective connectivity when time was dilated (V-A). Second, when time was compressed (A-V) activation was greater in frontal cognitive-control centers, which guide decision making. These areas did not exhibit effective connectivity. Third, intrasensory timing was distinguished from intersensory timing partly by decreased striatal and increased superior parietal activation. These regions showed stronger connectivity with visual, memory, and cognitive-control centers during intersensory timing. Altogether, the results indicate that time dilation and compression arise from the connectivity strength of higher-sensory systems with other areas. Conversely, more extensive network interactions are needed with core timing (striatum) and attention (superior parietal) centers to integrate time codes for intersensory signals.

Keywords: attention; audiovisual temporal distortions; crossmodal timing; fMRI; sensory integration; striatum; temporal processing.


Figures

Figure 1
Figure 1
Time perception task. (A) Trial of events for each of the four conditions. Pairs of auditory (A) and/or visual (V) stimuli were successively presented. The standard (SI) and the comparison (CI) intervals were of the same modality in the unimodal conditions (A–A, V–V) and were different modalities in the crossmodal conditions (A–V, V–A). Prior to trial onset, a warning signal (flashing yellow cross and mixed 700-Hz tone) appeared for 350 ms followed by a 500-ms delay. A trial began with the presentation of the SI, followed by a 1.5-s delay, and then the CI. The participant indicated if the CI was shorter or longer than the SI by pressing a key with the right index or middle finger, respectively. (B) SI and CI durations. There were four different SIs. Each SI was paired with three shorter and three longer CIs that differed from the SI by successive increments of ±7%.
Figure 2
Figure 2
Task performance during fMRI scanning. Accuracy data were converted to the mean (standard error bars) percent longer and then averaged across the standard interval (SI) conditions and their respective comparison intervals (CIs). The left graph shows the mean percent longer responses for each unimodal (A–A, V–V) and crossmodal (V–A, A–V) condition. The right graph plots the mean percent longer responses for the unimodal and crossmodal conditions as a function of the CI duration. On the x axis, ±7, 14, and 21 designate CIs that were 7, 14, and 21% shorter (negative values) or longer (positive values) than the SI.
Figure 3
Figure 3
Cortical functional ROI (fROI). Twenty-one cortical fROI were identified by conjoining activation maps from the voxel-wise analyses. Tests of modality, timing condition, and the interaction were conducted on these fROI. The fROI are color coded according to whether activation was affected by each of these factors. In all three columns, purple denotes no effect of a particular factor on activation. For the test of modality (left column), red designates a significant difference between the A–A and V–V conditions. For the test of timing condition (middle column), yellow signifies a significant difference between the unimodal and the crossmodal conditions. In the right column, green signifies a significant CI modality × timing condition interaction.
Figure 4
Figure 4
Subcortical functional ROI (fROI). Four subcortical fROI were identified by conjoining the activation maps from the voxel-wise analyses. In all of the fROI, activation was greater in the unimodal than the crossmodal timing condition. No other effects were significant. z coordinates are the superior (+)/inferior (−) distance in millimeter from the anterior commissure.
Figure 5
Figure 5
Signal change in regions showing an effect of timing condition. Graphs display representative regions showing differences in activation between the unimodal (A–A, V–V) and crossmodal (V–A, A–V) conditions. Mean (standard error bars) area under the curve (AUC) is plotted for each condition. Bracketed numbers reference regions detailed in Table 1. L, left hemisphere; R, right hemisphere; B, bilateral hemispheres; SMA, supplementary motor area; MFG, middle frontal gyrus; IFG, inferior frontal gyrus.
Figure 6
Figure 6
Signal change in regions showing an interaction. Graphs display regions showing a CI modality × timing condition interaction. Mean (standard error bars) area under the curve (AUC) is plotted for each condition. An asterisk designates the significance of key follow-up planned comparisons between the unimodal (A–A versus V–V) and crossmodal (V–A versus A–V) conditions. Bracketed numbers reference regions detailed in Table 1. L, left hemisphere; R, right hemisphere; SMA, supplementary motor area; MFG, middle frontal gyrus; IFG, inferior frontal gyrus; PH, parahippocampus.
Figure 7
Figure 7
Regions showing connectivity with the striatum, SMA, and parietal cortex that was modulated by timing condition. Spatial locations of regions showing interactions with a seed fROI are displayed on sagittal and axial sections (neurological view). (A) Right caudate (turquoise) and right putamen (red) seeds. (B) Left (blue) and right (green) supplementary motor area (SMA) seeds. (C) Left superior parietal cortex seed (orange). The spatial overlap between two seeds in their interacting regions (A,B) is shown in yellow. Coordinates beneath sagittal and axial sections represent the distance in millimeter from the anterior commissure: x, right (+)/left (−); superior (+)/inferior (−). See Table 2 for details about individual activation foci.
Figure 8
Figure 8
Regions showing connectivity with higher-sensory areas that was modulated by the time dilation and compression conditions. Spatial locations of regions showing interactions with a seed fROI are displayed on sagittal and axial sections (neurological view). (A) Left (green areas) and right superior temporal (blue areas) seeds. (B) Left (red) and right (turquoise) posterior insula seeds. (C) Left middle-occipital seed (orange). The spatial overlap between two seeds in their interacting regions (A,B) is shown in yellow. Coordinates beneath sagittal and axial sections represent the distance in millimeter from the anterior commissure: x, right (+)/left (−); superior (+)/inferior (−). See Table 3 for details about individual activation foci.

References

    1. Bushara K. O., Grafman J., Hallett M. (2001). Neural correlates of auditory-visual stimulus onset asynchrony detection. J. Neurosci. 21, 300–304 - PMC - PubMed
    1. Calvert G. A. (2001). Crossmodal processing in the human brain: insights from functional neuroimaging studies. Cereb. Cortex 11, 1110–112310.1093/cercor/11.12.1110 - DOI - PubMed
    1. Calvert G. A., Hansen P. C., Iversen S. D., Brammer M. J. (2001). Detection of audio-visual integration sites in humans by application of electrophysiological criteria to the BOLD effect. Neuroimage 14, 427–43810.1006/nimg.2001.0812 - DOI - PubMed
    1. Carroll C. A., Boggs J., O’Donnell B. F., Shekhar A., Hetrick W. P. (2008). Temporal processing dysfunction in schizophrenia. Brain Cogn. 67, 150–16110.1016/j.bandc.2007.12.005 - DOI - PMC - PubMed
    1. Casini L., Macar F. (1997). Effects of attention manipulation on judgments of duration and of intensity in the visual modality. Mem. Cognit. 25, 812–81810.3758/BF03211325 - DOI - PubMed