. 2011 Jul 27:5:7.
doi: 10.3389/fninf.2011.00007. eCollection 2011.

The retrosplenial cortex: intrinsic connectivity and connections with the (para)hippocampal region in the rat. An interactive connectome

Affiliations

The retrosplenial cortex: intrinsic connectivity and connections with the (para)hippocampal region in the rat. An interactive connectome

Jørgen Sugar et al. Front Neuroinform. .

Abstract

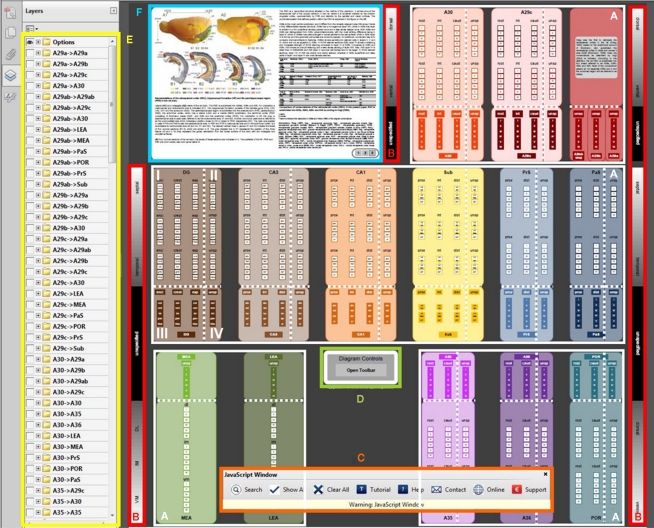
A connectome is an indispensable tool for brain researchers, since it quickly provides comprehensive knowledge of the brain's anatomical connections. Such knowledge lies at the basis of understanding network functions. Our first comprehensive and interactive account of brain connections comprised the rat hippocampal-parahippocampal network. We have now added all anatomical connections with the retrosplenial cortex (RSC) as well as the intrinsic connections of this region, because of the interesting functional overlap between these brain regions. The RSC is involved in a variety of cognitive tasks including memory, navigation, and prospective thinking, yet the exact role of the RSC and the functional differences between its subdivisions remain elusive. The connectome presented here may help to define this role by providing an unprecedented interactive and searchable overview of all connections within and between the rat RSC, parahippocampal region and hippocampal formation.

Keywords: connectivity; connectome; hippocampal formation; interactive; parahippocampal region; retrosplenial cortex; tract tracing.


Figures

Figure 1
Figure 1
Representations of the retrosplenial cortex (RSC), hippocampal formation (HF) and the parahippocampal region (PHR) in the rat brain. Lateral (A1) and midsagittal (A2) views of the rat brain. The RSC is subdivided into A29ab, A29c, and A30. For orientation a rostrocaudal and dorsoventral axis is indicated (A1). The HF consists of the dentate gyrus (DG), CA3, CA2, CA1, and the subiculum (Sub). The PHR is subdivided into the presubiculum (PrS), parasubiculum (PaS), the entorhinal cortex, which has a lateral (LEA) and a medial (MEA) subdivision, the perirhinal cortex (PER; consisting of Brodmann areas (A)35 and A36) and the postrhinal cortex (POR). For orientation in HF the long or septotemporal axis is used [also referred to as the dorsoventral axis; (A1,B2)]. Another commonly used axis is referred to as the proximodistal axis which indicates a position closer to DG or closer to PHR, respectively (B1). The main axis applied in case of PrS and PaS is also the septotemporal axis, in PER and POR a rostrocaudal axis and in the entorhinal cortex is a dorsolateral-to-ventromedial axis [dl and vm; (A1,A2)]. The dashed vertical lines in panels (A1,A2) indicate the levels of four coronal sections (B1–B4), which are shown in (B). The gray stippled line in (A1) represents the position of the rhinal fissure (rf) and in (A2) they represent the global delineation from the dorsal surface of the brain with the midsagittal and occipital surfaces. (B) Four coronal sections of the rat brain; the levels of these sections are indicated in (A). The subfields of the HF, PHR and RSC are color-coded, see color panel below (B).
Figure 2
Figure 2
Cytoarchitecture of rat retrosplenial cortex (RSC). Photomicrograph of a coronal section stained for NeuN (high power image taken from the section shown in Figure 1B2), illustrating the cytoarchitectonic characteristics of A29a, A29b, A29c, and A30. A29a has a homogenous layer II/III and lacks fully differentiated deep layers. In A29b layer II/III is divided into a thin superficial densely packed zone and a less dense deeper zone. A29c has a more differentiated layer V and a more equally dense layer II/III compared to A29b and a thinner layer IV compared to A30. A30 shows a widening and a less dense packing of layer II/III and layer V neuronal cell bodies tend to be larger. Layer VI is mostly developed in A30 and A29c and almost absent in A29a and b (for more details see Vogt et al., ; Jones et al., 2005).
Figure 3
Figure 3
Retrosplenial and hippocampal–parahippocampal connectome. The connectome (see ratbrain_connectome.pdf in Supplementary Material) consists of 14 large, color-coded boxes, which represent the sub-regions of the hippocampal formation, parahippocampal region, and retrosplenial cortex. In this figure, the user interface elements of the connectome are indicated with color-coded outlines and their meaning/purpose is explained. (A) In the white outlines, the 14 anatomical sub-regions are displayed. (B) The 14 anatomical sub-regions are three-dimensionally organized. However, the origin and termination of connections are not always described in full detail in the literature. Therefore, area boxes are divided into four quadrants. Quadrant I has full topological information, whereas the other quadrants have less topological detail. In quadrant I, the vertical axis in the connectome represents the septotemporal axis of dentate gyrus (DG), Cornu Ammonis (CA3 and CA1), subiculum (Sub), presubiculum (PrS) and parasubiculum (PaS), and the dorsoventral axis of medial and lateral entorhinal area (MEA and LEA), retrosplenial cortex (A29 and A30), perirhinal cortex (A35 and A36) and postrhinal cortex (POR). The sidebars (B) display the dorsoventral and septotemporal axes of the anatomical sub-regions. The horizontal axis within quadrant I and III represents the proximodistal axis in CA3, CA1, Sub, PrS, and PaS; the rostrocaudal axis in A29c, A30, A35, A36, and POR and the DG is subdivided into the inner/outer blades and crest region. Within the area boxes, the layers for each specific subarea are outlined. In quadrant II, the information of the vertical axis and the layers are specified, but no details of the horizontal axis are presented. In quadrant III the horizontal axis and the layers are represented, while in quadrant IV, only layer information is present. (C) The interactive connectome allows visualization of detailed connectivity patterns within and between sub-regions. To search for connections, use the search button on the toolbar (C). The toolbar has eight buttons (from left to right): Search for connections, show all connections, clear all connections, a short tutorial on how to search for connections, a help section, contact information, a link to the project website www.temporal-lobe.com and information about how to support this project. (D) If the toolbar is closed, clicking the “open toolbar” button will restore it. (E) After a search is carried out, the retrieved connections will be drawn in the diagram between the appropriate areas and quadrants. Additionally, an eye-icon will appear in the layers panel on the left (E). This is an alphabetically sorted list of “from → to” connection groups that can also be switched on or off manually. In front of each group is a “+” icon. Clicking this icon expands the list of individual connections that make up the group, allowing one to select connections originating from a specific cortical layer or according to a specific three-dimensional projection pattern. (F) The figure panel provides a detailed anatomical description of the retrosplenial cortex, the hippocampal formation and the parahipppcampal region, together with translation tables for nomenclature. Use the buttons in this panel to switch between the figures.

References

    1. Agster K. L., Burwell R. D. (2009). Cortical efferents of the perirhinal, postrhinal, and entorhinal cortices of the rat. Hippocampus 19, 1159–118610.1002/hipo.20578 - DOI - PMC - PubMed
    1. Audinat E., Conde F., Crepel F. (1988). Cortico-cortical connections of the limbic cortex of the rat. Exp. Brain Res. 69, 439–44310.1007/BF00247590 - DOI - PubMed
    1. Baks-Te Bulte L., Wouterlood F. G., Vinkenoog M., Witter M. P. (2005). Entorhinal projections terminate onto principal neurons and interneurons in the subiculum: a quantitative electron microscopical analysis in the rat. Neuroscience 136, 729–73910.1016/j.neuroscience.2005.03.001 - DOI - PubMed
    1. Boccara C. N., Sargolini F., Thoresen V. H., Solstad T., Witter M. P., Moser E. I., Moser M. B. (2010). Grid cells in pre- and parasubiculum. Nat. Neurosci. 13, 987–99410.1038/nn.2602 - DOI - PubMed
    1. Borst J. G., Leung L. W., Macfabe D. F. (1987). Electrical activity of the cingulate cortex. II. Cholinergic modulation. Brain Res. 407, 81–9310.1016/0006-8993(87)91221-2 - DOI - PubMed

LinkOut - more resources