

Quantitative PK-PD model-based translational pharmacology of a novel kappa opioid receptor antagonist between rats and humans
- PMID: 21847689
- PMCID: PMC3231851
- DOI: 10.1208/s12248-011-9296-3
Quantitative PK-PD model-based translational pharmacology of a novel kappa opioid receptor antagonist between rats and humans
Abstract
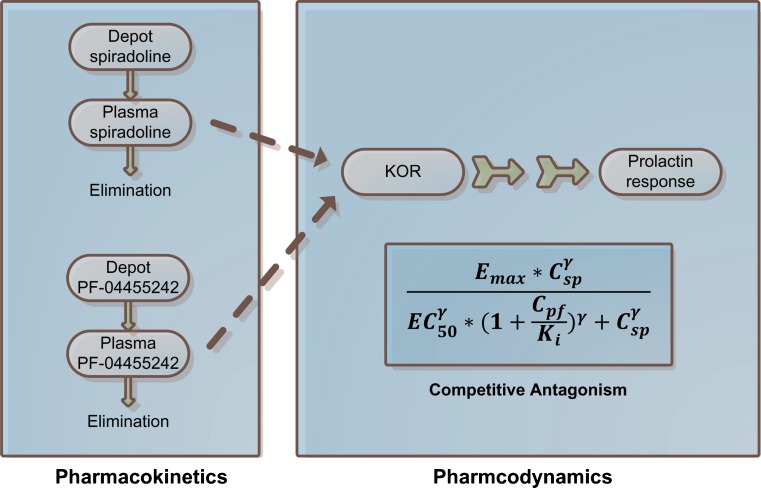
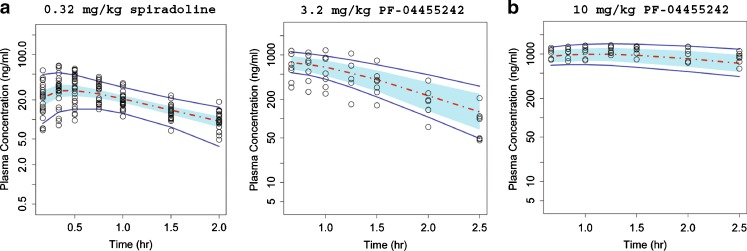
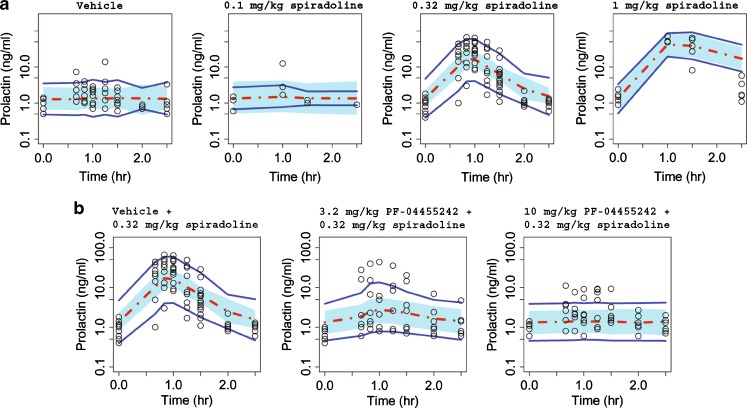
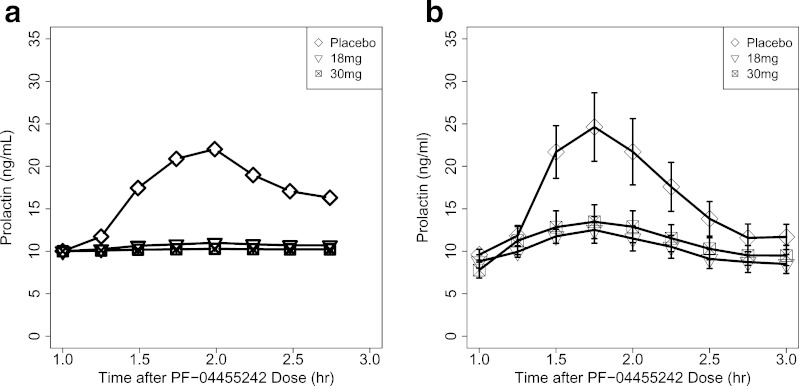
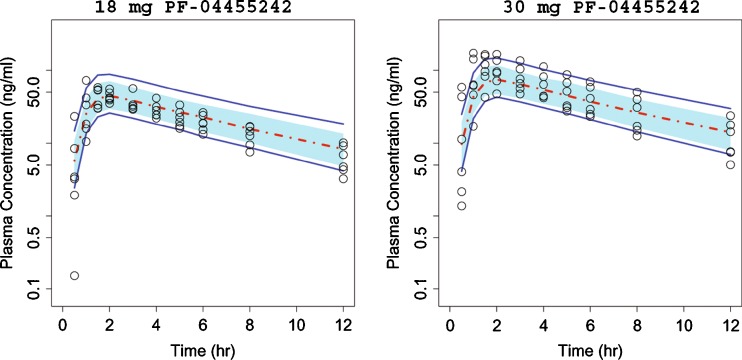
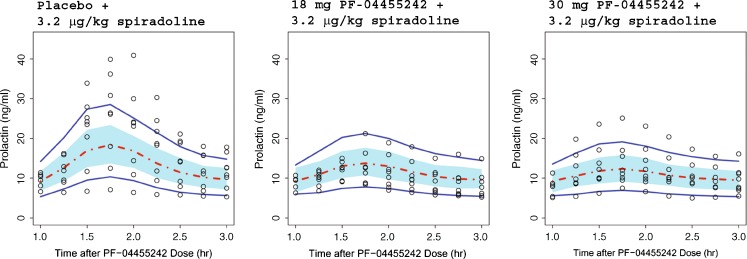
Pharmacokinetic-pharmacodynamic (PK-PD) modeling greatly enables quantitative implementation of the "learn and confirm" paradigm across different stages of drug discovery and development. This work describes the successful prospective application of this concept in the discovery and early development of a novel κ-opioid receptor (KOR) antagonist, PF-04455242, where PK-PD understanding from preclinical biomarker responses enabled successful prediction of the clinical response in a proof of mechanism study. Preclinical data obtained in rats included time course measures of the KOR antagonist (PF-04455242), a KOR agonist (spiradoline), and a KOR-mediated biomarker response (prolactin secretion) in plasma. Clinical data included time course measures of PF-04455242 and prolactin in 24 healthy volunteers following a spiradoline challenge and single oral doses of PF-04455242 (18 and 30 mg). In both species, PF-04455242 successfully reversed spiradoline-induced prolactin response. A competitive antagonism model was developed and implemented within NONMEM to describe the effect of PF-04455242 on spiradoline-induced prolactin elevation in rats and humans. The PK-PD model-based estimate of K(i) for PF-04455242 in rats was 414 ng/mL. Accounting for species differences in unbound fraction, in vitro K(i) and brain penetration provided a predicted human K(i) of 44.4 ng/mL. This prediction was in good agreement with that estimated via the application of the proposed PK-PD model to the clinical data (i.e., 39.2 ng/mL). These results illustrate the utility of the proposed PK-PD model in supporting the quantitative translation of preclinical studies into an accurate clinical expectation. As such, the proposed PK-PD model is useful for supporting the design, selection, and early development of novel KOR antagonists.
Figures
Similar articles
-
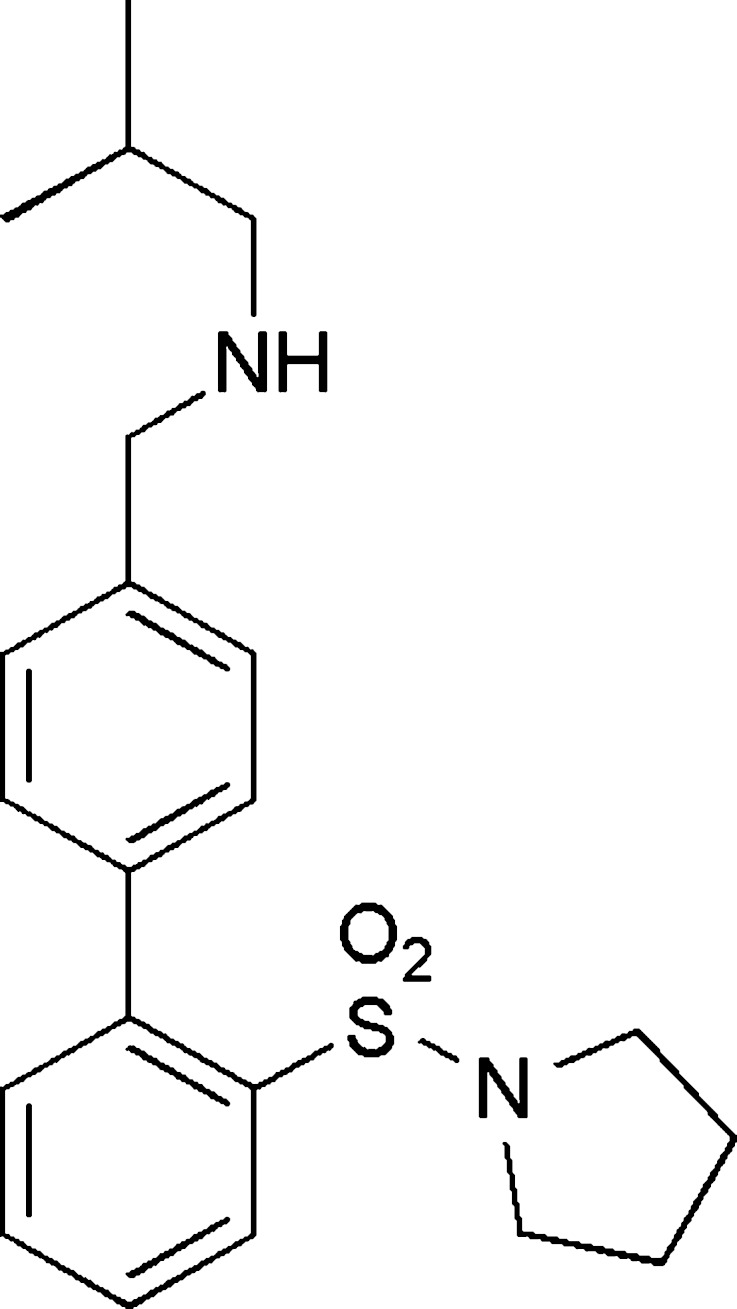
Pharmacological characterization of 2-methyl-N-((2'-(pyrrolidin-1-ylsulfonyl)biphenyl-4-yl)methyl)propan-1-amine (PF-04455242), a high-affinity antagonist selective for κ-opioid receptors.J Pharmacol Exp Ther. 2011 Nov;339(2):555-66. doi: 10.1124/jpet.111.185108. Epub 2011 Aug 5. J Pharmacol Exp Ther. 2011. PMID: 21821697
-
Evaluation of the agonist PET radioligand [¹¹C]GR103545 to image kappa opioid receptor in humans: kinetic model selection, test-retest reproducibility and receptor occupancy by the antagonist PF-04455242.Neuroimage. 2014 Oct 1;99:69-79. doi: 10.1016/j.neuroimage.2014.05.033. Epub 2014 May 17. Neuroimage. 2014. PMID: 24844744 Free PMC article.
-
Design and discovery of a selective small molecule κ opioid antagonist (2-methyl-N-((2'-(pyrrolidin-1-ylsulfonyl)biphenyl-4-yl)methyl)propan-1-amine, PF-4455242).J Med Chem. 2011 Aug 25;54(16):5868-77. doi: 10.1021/jm2006035. Epub 2011 Jul 22. J Med Chem. 2011. PMID: 21744827
-
Kappa Opioid Receptor Antagonists as Potential Therapeutics for Stress-Related Disorders.Annu Rev Pharmacol Toxicol. 2020 Jan 6;60:615-636. doi: 10.1146/annurev-pharmtox-010919-023317. Annu Rev Pharmacol Toxicol. 2020. PMID: 31914893 Review.
-
A review of the properties of spiradoline: a potent and selective kappa-opioid receptor agonist.CNS Drug Rev. 2003 Summer;9(2):187-98. doi: 10.1111/j.1527-3458.2003.tb00248.x. CNS Drug Rev. 2003. PMID: 12847558 Free PMC article. Review.
Cited by
-
Neuroendocrine effects of naltrexone versus nalmefene in humans.Hum Psychopharmacol. 2020 Mar;35(2):e2726. doi: 10.1002/hup.2726. Epub 2020 Feb 12. Hum Psychopharmacol. 2020. PMID: 32050055 Free PMC article. Clinical Trial.
-
Kappa Opioid Receptor Antagonists as Potential Therapeutics for Mood and Substance Use Disorders.Handb Exp Pharmacol. 2022;271:473-491. doi: 10.1007/164_2020_401. Handb Exp Pharmacol. 2022. PMID: 33174064
-
Preclinical to clinical translation of CNS transporter occupancy of TD-9855, a novel norepinephrine and serotonin reuptake inhibitor.Int J Neuropsychopharmacol. 2014 Dec 13;18(2):pyu027. doi: 10.1093/ijnp/pyu027. Int J Neuropsychopharmacol. 2014. PMID: 25522383 Free PMC article.
-
Pharmacokinetic-pharmacodynamic modelling of the anti-FcRn monoclonal antibody rozanolixizumab: Translation from preclinical stages to the clinic.CPT Pharmacometrics Syst Pharmacol. 2022 Jan;11(1):116-128. doi: 10.1002/psp4.12739. Epub 2021 Nov 23. CPT Pharmacometrics Syst Pharmacol. 2022. PMID: 34735735 Free PMC article.
-
The macrocyclic tetrapeptide [D-Trp]CJ-15,208 produces short-acting κ opioid receptor antagonism in the CNS after oral administration.Br J Pharmacol. 2013 May;169(2):426-36. doi: 10.1111/bph.12132. Br J Pharmacol. 2013. PMID: 23425081 Free PMC article.
References
-
- Quinn GP, Axelrod J, Brodie BB. Species, strain and sex differences in metabolism of hexobarbitone, amidopyrine, antipyrine and aniline. Biochem Pharmacol. 1958;1:152–9. doi: 10.1016/0006-2952(58)90024-8. - DOI
-
- Rane A, Wilkinson GR, Shand DG. Prediction of hepatic extraction ratio from in vitro measurement of intrinsic clearance. J Pharmacol Exp Ther. 1977;200(2):420–4. - PubMed
MeSH terms
Substances
LinkOut - more resources
Full Text Sources
Research Materials
