. 2011 Sep 27;50(38):8117-26.
doi: 10.1021/bi200911c. Epub 2011 Sep 2.

Mass spectrometry-based protein footprinting characterizes the structures of oligomeric apolipoprotein E2, E3, and E4

Affiliations

Mass spectrometry-based protein footprinting characterizes the structures of oligomeric apolipoprotein E2, E3, and E4

Brian Gau et al. Biochemistry. .

Abstract

The three common isoforms of apolipoprotein E (ApoE) differ at two sites in their 299 amino acid sequence; these differences modulate the structure of ApoE to affect profoundly the isoform associations with disease. The ε4 allele in particular is strongly associated with Alzheimer's disease. The study of the structural effects of these mutation sites in aqueous media is hampered by the aggregation proclivity of each ApoE isoform. Hence, understanding the differences between isoforms has thus far relied on lower resolution biophysical measurements, mutagenesis, homology studies, and the use of truncated ApoE variants. In this study, we report two comparative studies of the ApoE family by using the mass spectrometry-based protein footprinting methods of FPOP and glycine ethyl ester (GEE) labeling. The first experiment examines the three full-length WT isoforms in their tetrameric state and finds that the overall structures are similar, with the exception of M108 in ApoE4 which is more solvent-accessible in this isoform than in ApoE2 and ApoE3. The second experiment provides clear evidence, from a comparison of the footprinting results of the wild-type proteins and a monomeric mutant, that several residues in regions 183-205 and 232-251 are involved in self-association.


Figures

Figure 1
Figure 1
Comparison of the tryptic-peptide-resolved and residue-resolved FPOP labeling yields for ApoE3 and ApoE4. Panel A plots the difference in yield per residue between isoforms, relative to the maximum yield per residue for all residues of the same amino-acid type. Background modification yields observed in the control experiments are subtracted from their corresponding FPOP yields before the relative value is determined. Error bars are propagated from the standard errors of the per-residue average labeling yields for ApoE3 FPOP, ApoE3 control, ApoE4 FPOP, and ApoE4 control treatments. Residues M108, Y162, P183, V185, and E266, shown in red, are significantly different between isoforms at 95% confidence by the Student’s t-test. Panel B plots the FPOP labeling yield/tryptic peptide of ApoE3 in black and ApoE4 in red. The background modification fraction per peptide has been subtracted. The light-blue areas convey the standard error of each labeling measurement. Where peptides exhibit very similar labeling levels, the red ApoE4 bars may obscure the ApoE3 bars.
Figure 2
Figure 2
Comparison of the tryptic-peptide-resolved and residue-resolved FPOP labeling yields for ApoE2 and ApoE3. Panel A plots the difference in yield per residue between isoforms, relative to the maximum yield per residue for all residues of the same amino-acid type. Background modification yields observed in the control experiments are subtracted from their corresponding FPOP yields before the relative value is determined. Error bars are determined as described in Figure 1. Residues Y162, E255, and E266, shown in red, are significantly different between isoforms at 95% confidence by the Student’s t-test. Panel B plots the FPOP labeling yield/tryptic peptide of ApoE3 in black and ApoE2 in red. The background modification fraction per peptide has been subtracted. The light-blue areas convey the standard error of each labeling measurement. Where peptides exhibit very similar labeling levels, the red ApoE2 bars may obscure the ApoE3 bars.
Figure 3
Figure 3
Comparison of the tryptic-peptide-resolved and residue-resolved FPOP and GEE labeling yields for ApoE3 and ApoE3MM. Panel A plots the residue-resolved significant differences in FPOP yields between the proteins. Each yield difference is normalized to the maximum yield per residue for all residues of the same amino-acid type, averaged from all FPOP experiments. Background modification yields observed in the control experiments are subtracted from their corresponding FPOP yields before the relative value is determined. Error bars are determined as described in Figure 1. Significance was determined at 95% confidence by the Student’s t-test. Panel B plots the residue-resolved significant differences in 3 min GEE yields between the proteins. Each yield difference is normalized to the average yield per residue for all acidic residues, averaged from all 3 min GEE experiments. Error bars are the normalized standard errors for the 3 min measurement. Significant difference was defined as at least 2 GEE labeling time points exhibiting a difference at 95% confidence by the Student’s t-test, and having the same sign. The bottom panel shows the residues along the ApoE3 primary sequence exhibiting more labeling in the monomeric mutant. Black-underlined residues convey the significant FPOP labeling difference; red-underlined residues the significant GEE labeling difference.
Figure 4
Figure 4
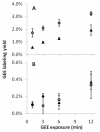
Representative plots of GEE labeling for 2 residues. Open circles denote ApoE3MM GEE-modified yields at 4 time points; solid triangles denote the ApoE3 yields. Residue E212 data is shown in plot A. Residue E109 data is shown in plot B.
Figure 5
Figure 5
ApoE4 24-162 X-ray crystal structure(62) with R61, M64, M68, and M108 sidechains depicted by element type and van der Waals radius.
Figure 6
Figure 6
A model of ApoE3 (63) shown with marked residues that exhibited a statistically significant increase in labeling in the monomeric mutant. Blue residues were indicated by FPOP labeling, and green residues by GEE labeling.

References

    1. Mahley RW. Apolipoprotein E: cholesterol transport protein with expanding role in cell biology. Science. 1988;240:622–630. - PubMed
    1. Strittmatter WJ, Saunders AM, Schmechel D, Pericak-Vance M, Enghild J, Salvesen GS, Roses AD. Apolipoprotein E: high-avidity binding to beta- amyloid and increased frequency of type 4 allele in late-onset familial Alzheimer disease. Proc. Natl. Acad. Sci. U.S.A. 1993;90:1977–1981. - PMC - PubMed
    1. Corder EH, Saunders AM, Strittmatter WJ, Schmechel DE, Gaskell PC, Small GW, Roses AD, Haines JL, Pericak-Vance MA. Gene dose of apolipoprotein E type 4 allele and the risk of Alzheimer’s disease in late onset families. Science. 1993;261:921–923. - PubMed
    1. Bu G. Apolipoprotein E and its receptors in Alzheimer’s disease: pathways, pathogenesis and therapy. Nat Rev Neurosci. 2009;10:333–344. - PMC - PubMed
    1. Weisgraber KH. Advances in Protein Chemistry. Academic Press; 1994. Apolipoprotein E: Structure-Function Relationships; pp. 249–302. - PubMed

Publication types

MeSH terms