. 2011 Oct;119(2):275-82.
doi: 10.1111/j.1471-4159.2011.07432.x. Epub 2011 Sep 20.

Quality control parameters on a large dataset of regionally dissected human control brains for whole genome expression studies

Affiliations
Free PMC article

Quality control parameters on a large dataset of regionally dissected human control brains for whole genome expression studies

Daniah Trabzuni et al. J Neurochem. 2011 Oct.
Free PMC article

Abstract

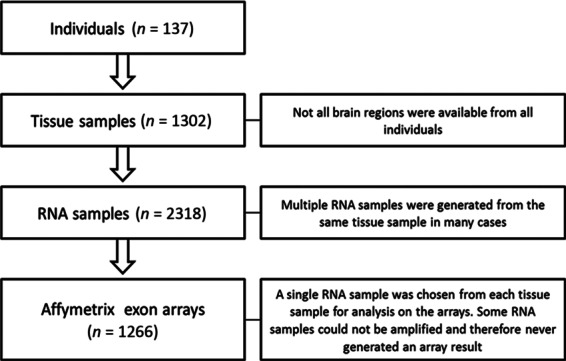
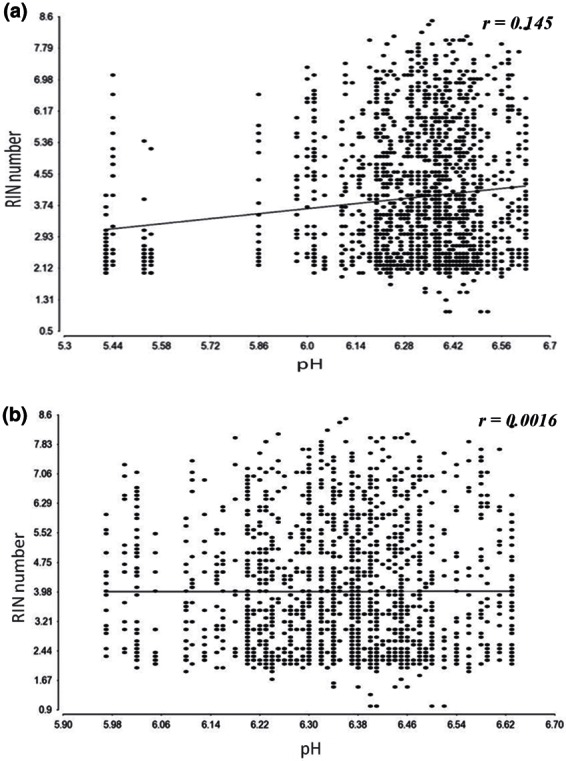
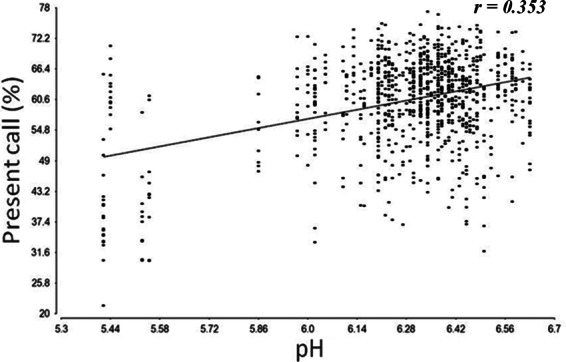
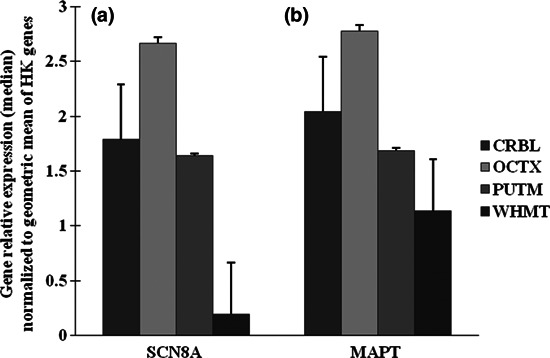
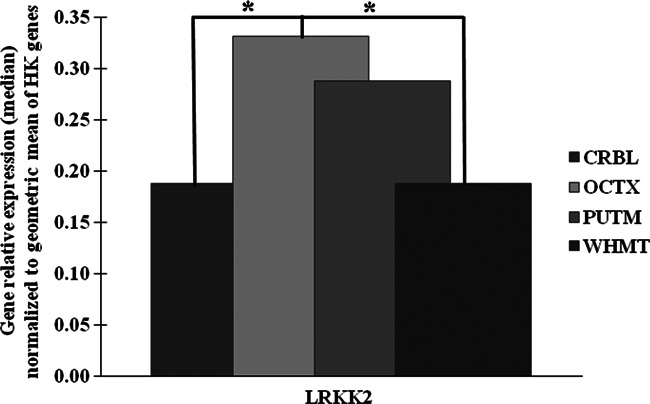
We are building an open-access database of regional human brain expression designed to allow the genome-wide assessment of genetic variability on expression. Array and RNA sequencing technologies make assessment of genome-wide expression possible. Human brain tissue is a challenging source for this work because it can only be obtained several and variable hours post-mortem and after varying agonal states. These variables alter RNA integrity in a complex manner. In this report, we assess the effect of post-mortem delay, agonal state and age on gene expression, and the utility of pH and RNA integrity number as predictors of gene expression as measured on 1266 Affymetrix Exon Arrays. We assessed the accuracy of the array data using QuantiGene, as an independent non-PCR-based method. These quality control parameters will allow database users to assess data accuracy. We report that within the parameters of this study post-mortem delay, agonal state and age have little impact on array quality, array data are robust to variable RNA integrity, and brain pH has only a small effect on array performance. QuantiGene gave very similar expression profiles as array data. This study is the first step in our initiative to make human, regional brain expression freely available.


Figures

Fig. 1
Fig. 1
Description of the data used in the analysis.
Fig. 2
Fig. 2
(a) Scatter plot for total RNA samples with linear regression line of RIN numbers for pH. Plot shows the effect of pH on RIN number for RNA samples isolated from 13 region of control brain tissue. Test p-values is test p-value = 1.0 × 10⁻⁴, r-value = 0.145. Including the low pH values of < 5.9. (b) Scatter plot for total RNA samples with linear regression line of RIN numbers for pH. Plot shows the effect of pH on RIN number for RNA samples isolated from 13 region of control brain tissue. No significant correlation was obtained with r-value = 0.0016 and p-value = 0.82. Samples with low pH value of < 5.9 were excluded.
Fig. 3
Fig. 3
Bar chart to show variation in %P by brain region (CRBL, WHMT).This graph shows the different performance of samples from specific brain regions on the array. These results are highly significant p-values (1.3 × 10⁻²⁴ ). The heights of the bars represent the mean. The error bars represent the SEM.
Fig. 4
Fig. 4
Scatter plot for total RNA samples with linear regression line of Present call (%P) for pH. Scatter plot shows that pH significantly explains 12.0% of the variation in %P (p = 2.3 × 10⁻⁹, r = 0.353), including samples with low pH values. Low pH values are driving the regression analysis.
Fig. 5
Fig. 5
QuantiGene validation of microarray expression data. (a) SCN8A expression level between different regions. The graph shows high expression in OCTX compare with other regions. It is clear that this gene in mostly not expressed in WHMT region (expression level close to zero) also it presenting large error bar. (b) MAPT, showing higher expression in OCTX compare with other brain regions. These results confirm the array data with significant p-values of < 0.01. The expression level is presenting the mean and the error bars is SEM.
Fig. 6
Fig. 6
QuantiGene validation of microarray expression data for LRRK2 expression level in different regions. The graph shows higher expression in OCTX compare with other regions. Wilcoxon-signed rank test was performed and these results confirm the difference between regions in array data is significant. The expression level is presenting the median and the stars indicating the significant difference in expression with p-values of < 0.01. In this case, as LRRK2 expression level was very low, it was unreliable to use SEM and Wilcoxon’s test was performed using the median values.

References

    1. Arikawa E, Sun Y, Wang J, Zhou Q, Ning B, Dial SL, Guo L, Yang J. Cross-platform comparison of SYBR Green real-time PCR with TaqMan PCR, microarrays and other gene expression measurement technologies evaluated in the MicroArray Quality Control (MAQC) study. BMC Genomics. 2008;9:328. - PMC - PubMed
    1. Bahar B, Monahan FJ, Moloney AP, Schmidt O, MacHugh DE, Sweeney T. Long-term stability of RNA in post-mortem bovine skeletal muscle, liver and subcutaneous adipose tissues. BMC Mol. Biol. 2007;8:108. - PMC - PubMed
    1. Barrachina M, Castano E, Ferrer I. TaqMan PCR assay in the control of RNA normalization in human post-mortem brain tissue. Neurochem. Int. 2006;49:276–284. - PubMed
    1. Beach TG, Sue LI, Walker DG, Roher AE, Lue L, Vedders L, Connor DJ, Sabbagh MN, Rogers J. The Sun Health Research Institute Brain Donation Program: description and experience, 1987–2007. Cell Tissue Bank. 2008;9:229–245. - PMC - PubMed
    1. Birdsill AC, Walker DG, Lue L, Sue LI, Beach TG. Postmortem interval effect on RNA and gene expression in human brain tissue. Cell Tissue Bank. 2010 [Epub ahead of print] - PMC - PubMed

Publication types

MeSH terms