The fornix sign: a potential sign for Alzheimer's disease based on diffusion tensor imaging
- PMID: 21848679
- PMCID: PMC3256282
- DOI: 10.1111/j.1552-6569.2011.00633.x
The fornix sign: a potential sign for Alzheimer's disease based on diffusion tensor imaging
Abstract
Background: We investigated a simple imaging sign for Alzheimer's disease (AD), using diffusion tensor imaging (DTI). We hypothesized that a reduction in fractional anisotropy (FA) in the fornix could be utilized as an imaging sign.
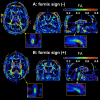
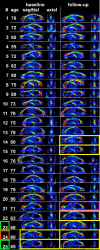
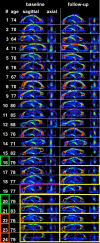
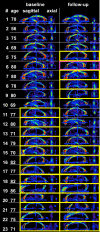
Methods: Twenty-three patients with AD, 24 patients with amnestic mild cognitive impairment (aMCI), and 25 control participants (NC) underwent DTI at baseline and 1 year later. The diagnosis was reevaluated 1 year and 3 years after the initial scan. A color-scaled FA map was used to visually identify the FA reduction ("fornix sign"). We investigated whether the fornix sign could separate AD from NC, and could predict progression from aMCI to AD or NC to aMCI. We also quantified FA of the fornix to validate the fornix sign.
Results: The fornix sign was identical to the lack of any voxels with an FA > .52 within the fornix. The fornix sign differentiated AD from NC with specificity of 1.0 and sensitivity of .56. It predicted conversion from NC to aMCI with specificity of 1.0 and sensitivity of .67, and from aMCI to AD with specificity of .94 and sensitivity of .83.
Conclusion: The fornix sign is a promising predictive imaging sign of AD.
Copyright © 2011 by the American Society of Neuroimaging.
Figures


Similar articles
-
The Uncinate Fasciculus as a Predictor of Conversion from Amnestic Mild Cognitive Impairment to Alzheimer Disease.J Neuroimaging. 2015 Sep-Oct;25(5):748-53. doi: 10.1111/jon.12196. Epub 2014 Dec 10. J Neuroimaging. 2015. PMID: 25491469
-
Comparison of diffusion tensor image study in association fiber tracts among normal, amnestic mild cognitive impairment, and Alzheimer's patients.Neurol India. 2011 Mar-Apr;59(2):168-73. doi: 10.4103/0028-3886.79129. Neurol India. 2011. PMID: 21483111
-
Use of diffusion tensor imaging for evaluating changes in the microstructural integrity of white matter over 3 years in patients with amnesic-type mild cognitive impairment converting to Alzheimer's disease.J Neuroimaging. 2014 Jul-Aug;24(4):343-8. doi: 10.1111/jon.12061. Epub 2013 Nov 19. J Neuroimaging. 2014. PMID: 24251793
-
The role of diffusion tensor imaging and fractional anisotropy in the evaluation of patients with idiopathic normal pressure hydrocephalus: a literature review.Neurosurg Focus. 2016 Sep;41(3):E12. doi: 10.3171/2016.6.FOCUS16192. Neurosurg Focus. 2016. PMID: 27581308 Review.
-
Fractional anisotropy of the fornix and hippocampal atrophy in Alzheimer's disease.Front Aging Neurosci. 2014 Nov 13;6:316. doi: 10.3389/fnagi.2014.00316. eCollection 2014. Front Aging Neurosci. 2014. PMID: 25431558 Free PMC article. Review.
Cited by
-
Axonal tract tracing for delineating interacting brain regions: implications for Alzheimer's disease-associated memory.Future Neurol. 2014 Jan 1;9(1):89-98. doi: 10.2217/fnl.13.67. Future Neurol. 2014. PMID: 24678267 Free PMC article.
-
White matter structural connectivity and episodic memory in early childhood.Dev Cogn Neurosci. 2017 Dec;28:41-53. doi: 10.1016/j.dcn.2017.11.001. Epub 2017 Nov 16. Dev Cogn Neurosci. 2017. PMID: 29175538 Free PMC article.
-
Fornix White Matter is Correlated with Resting-State Functional Connectivity of the Thalamus and Hippocampus in Healthy Aging but Not in Mild Cognitive Impairment - A Preliminary Study.Front Aging Neurosci. 2015 Feb 5;7:10. doi: 10.3389/fnagi.2015.00010. eCollection 2015. Front Aging Neurosci. 2015. PMID: 25698967 Free PMC article.
-
The role of diffusion tensor imaging in detecting microstructural changes in prodromal Alzheimer's disease.CNS Neurosci Ther. 2014 Jan;20(1):3-9. doi: 10.1111/cns.12166. Epub 2013 Dec 12. CNS Neurosci Ther. 2014. PMID: 24330534 Free PMC article. Review.
-
Splenium tract projections of the corpus callosum to the parietal cortex classifies Alzheimer's disease and mild cognitive impairment.Neurosci Lett. 2023 Jul 27;810:137331. doi: 10.1016/j.neulet.2023.137331. Epub 2023 Jun 9. Neurosci Lett. 2023. PMID: 37302566 Free PMC article.
References
-
- Duan JH, Wang HQ, Xu J, Lin X, Chen SQ, Kang Z, Yao ZB. White matter damage of patients with Alzheimer's disease correlated with the decreased cognitive function. Surg Radiol Anat. 2006;28:150–6. - PubMed
-
- Naggara O, Oppenheim C, Rieu D, Raoux N, Rodrigo S, Dalla Barba G, Meder JF. Diffusion tensor imaging in early Alzheimer's disease. Psychiatry Res. 2006;146:243–9. - PubMed
-
- Rose SE, Chen F, Chalk JB, Zelaya FO, Strugnell WE, Benson M, Semple J, Doddrell DM. Loss of connectivity in Alzheimer's disease: an evaluation of white matter tract integrity with colour coded MR diffusion tensor imaging. Journal of neurology, neurosurgery, and psychiatry. 2000;69:528–30. - PMC - PubMed
-
- Sydykova D, Stahl R, Dietrich O, Ewers M, Reiser MF, Schoenberg SO, Moller HJ, Hampel H, Teipel SJ. Fiber connections between the cerebral cortex and the corpus callosum in Alzheimer's disease: a diffusion tensor imaging and voxel-based morphometry study. Cereb Cortex. 2007;17:2276–82. - PubMed
Publication types
MeSH terms
Grants and funding
LinkOut - more resources
Full Text Sources
Medical

