. 2011 Aug 17:12:343.
doi: 10.1186/1471-2105-12-343.

A systems approach to identifying correlated gene targets for the loss of colour pigmentation in plants

Affiliations

A systems approach to identifying correlated gene targets for the loss of colour pigmentation in plants

Sangaalofa T Clark et al. BMC Bioinformatics. .

Abstract

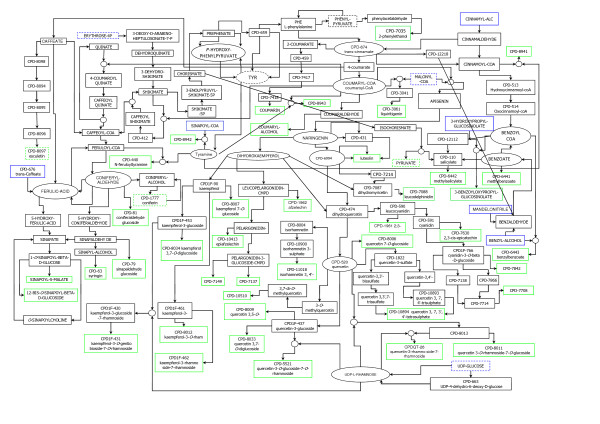
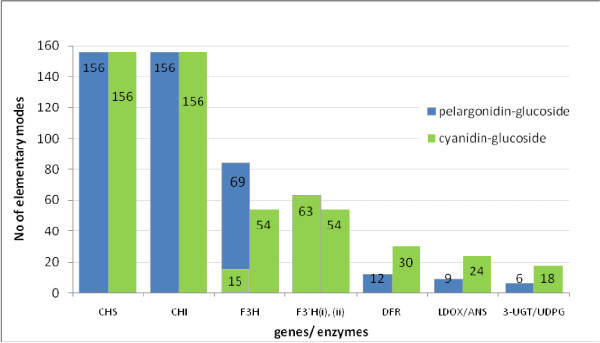
Background: The numerous diverse metabolic pathways by which plant compounds can be produced make it difficult to predict how colour pigmentation is lost for different tissues and plants. This study employs mathematical and in silico methods to identify correlated gene targets for the loss of colour pigmentation in plants from a whole cell perspective based on the full metabolic network of Arabidopsis. This involves extracting a self-contained flavonoid subnetwork from the AraCyc database and calculating feasible metabolic routes or elementary modes (EMs) for it. Those EMs leading to anthocyanin compounds are taken to constitute the anthocyanin biosynthetic pathway (ABP) and their interplay with the rest of the EMs is used to study the minimal cut sets (MCSs), which are different combinations of reactions to block for eliminating colour pigmentation. By relating the reactions to their corresponding genes, the MCSs are used to explore the phenotypic roles of the ABP genes, their relevance to the ABP and the impact their eliminations would have on other processes in the cell.

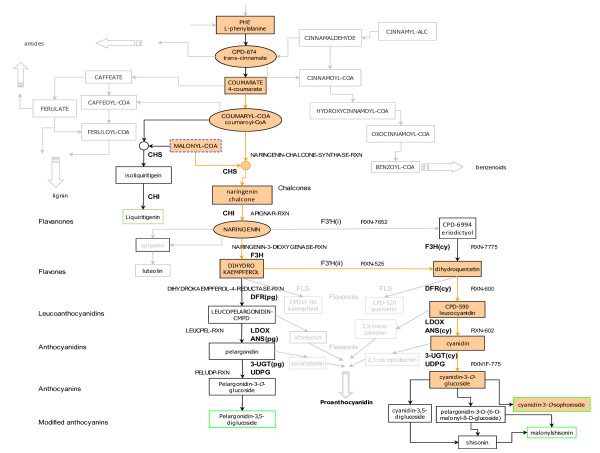
Results: Simulation and prediction results of the effect of different MCSs for eliminating colour pigmentation correspond with existing experimental observations. Two examples are: i) two MCSs which require the simultaneous suppression of genes DFR and ANS to eliminate colour pigmentation, correspond to observational results of the same genes being co-regulated for eliminating floral pigmentation in Aquilegia and; ii) the impact of another MCS requiring CHS suppression, corresponds to findings where the suppression of the early gene CHS eliminated nearly all flavonoids but did not affect the production of volatile benzenoids responsible for floral scent.

Conclusions: From the various MCSs identified for eliminating colour pigmentation, several correlate to existing experimental observations, indicating that different MCSs are suitable for different plants, different cells, and different conditions and could also be related to regulatory genes. Being able to correlate the predictions with experimental results gives credence to the use of these mathematical and in silico analyses methods in the design of experiments. The methods could be used to prioritize target enzymes for different objectives to achieve desired outcomes, especially for less understood pathways.


Figures

Figure 1
Figure 1
The Arabidopsis flavonoid subnetwork. In Figure 1 the compounds are drawn as rectangular and oval shapes. Black refers to internal metabolites, blue to external substrates and green to external products; dotted lines specify the metabolite taking part in other reactions outside the subnetwork. 'CPD' is an abbreviation for 'COMPOUND'. This is one form of the names (synonyms) given to compounds in the AraCyc database. For example, the name for 'liquiritigenin' in the AraCyc database and used in the data files available for downloading is CPD-3041.
Figure 2
Figure 2
Classification of EMs calculated from the flavonoid subnetwork. Figure 2 classifies the EMs into different flavonoid and non-flavonoid groups according to the phenotypic functions of the products in the network.
Figure 3
Figure 3
The ABP nodes extracted from the reconstructed flavonoid subnetwork of Arabidopsis. Figure 3 is a detailed part of the self-contained subnetwork showing the subset of nodes or metabolites in the 24 EMs that constitute the ABP. The compound groups that are not directly related to anthocyanins, are shown as greyed-out side branches from the ABP. Highlighted is an example of one anthocyanin EM leading to the formation of cyanidin 3-O-sophoroside. The names of compounds and reactions are as assigned in the AraCyc database [63]. Enzymes: CHS: Chalcone Synthase; CHI: Chalcone isomerase; F3H: Flavanone 3-hydroxylase; F3'H: Flavanone 3'-hydroxylase; DFR: Dihydroflavonol reductase; ANS: Anthocyanidin synthase; LDOX: Leucoanthocyanidin dioxygenase; FLS: Flavonol synthase; UDPG: UDP-glycosyltransferase; 3-UGT: Anthocyanidin 3-O-glucosyltransferase; 5-GT: Anthocyanin 5-O-glucosyltransferase (Hexosyltransferase); Ss5MaT1: Anthocyanin 5-O-glucoside 6-O-malonyltransferase (Acyltransferase); 2.4.1.- Hexosyltransferases; 2.3.1.- Acyltransferases: Transferring groups other than aminoacyl groups. (Pg) indicates enzymes corresponding to reactions related to pelargonidin-type compounds; (Cy) indicates enzymes corresponding to reactions related to cyanidin-type compounds.
Figure 4
Figure 4
Participation of ABP genes. Figure 4 illustrates the number of EMs the two Arabidopsis anthocyanin compounds participate in. The genes on the graph correspond to their positions in the ABP sequence: the earliest gene in the ABP sequence (CHS) starts on the left hand side and the latest genes (UDPG/3-UGT) are on the right hand side. Refer to Figure 3 for details and explanation of abbreviated gene names.
Figure 5
Figure 5
The number of EMs not affected by each MCS. The number of EMs (not including the 24 anthocyanin EMs) not affected when the reaction(s) that constitute each MCS is/are blocked. The MCS numbers on the x-axis correspond to the MCS numbers in the first column of Table 3.
Figure 6
Figure 6
Fragility coefficients (fc) of the ABP genes. The fragility coefficients of the ABP genes in the production of each of the anthocyanidin glucosides. Refer to the 2nd bottom row of Table 3 for details of fc values.
Figure 7
Figure 7
Relative Fluxes (reaction rates): a) - Average reaction rates producing the flavonoid product compound classes. Average relative fluxes (reaction rates) producing the external flavonoid compound classes for each MCS. Flavonols1: kaempferol derivatives; Flavonols2: quercetin derivatives. b) - Average reaction rates producing the non-flavonoid compound groups. Average relative fluxes (reactions rates) producing the non-flavonoid compound groups for each MCS.

References

    1. Bohm BA. Introduction to Flavonoids. Vol. 2. Harwood Academic Publishers, Amsterdam, The Netherlands; 1998.
    1. Schwinn K, Davies K. In: Plant Pigments and their Manipulation. Davies KM, editor. Vol. 14. Blackwell Publishing; 2004. Flavonoids; pp. 92–149.
    1. Harborne JB, ed. The Flavonoids: Advances in Research Since 1986. London, UK: Chapman & Hall; 1994.
    1. Harborne JB, Williams CA. Advances in flavonoid research since 1992. Phytochemistry. 2000;55(6):481–504. doi: 10.1016/S0031-9422(00)00235-1. - DOI - PubMed
    1. Whittall JB, Voelckel C, Kliebenstein DJ, Hodges SA. Convergence, constraint and the role of gene expression during adaptive radiation: floral anthocyanins in Aquilegia. Molecular Ecology. 2006;15(14):4645–4657. doi: 10.1111/j.1365-294X.2006.03114.x. - DOI - PubMed

Publication types

LinkOut - more resources