

Data mining methods in the prediction of Dementia: A real-data comparison of the accuracy, sensitivity and specificity of linear discriminant analysis, logistic regression, neural networks, support vector machines, classification trees and random forests
- PMID: 21849043
- PMCID: PMC3180705
- DOI: 10.1186/1756-0500-4-299
Data mining methods in the prediction of Dementia: A real-data comparison of the accuracy, sensitivity and specificity of linear discriminant analysis, logistic regression, neural networks, support vector machines, classification trees and random forests
Abstract
Background: Dementia and cognitive impairment associated with aging are a major medical and social concern. Neuropsychological testing is a key element in the diagnostic procedures of Mild Cognitive Impairment (MCI), but has presently a limited value in the prediction of progression to dementia. We advance the hypothesis that newer statistical classification methods derived from data mining and machine learning methods like Neural Networks, Support Vector Machines and Random Forests can improve accuracy, sensitivity and specificity of predictions obtained from neuropsychological testing. Seven non parametric classifiers derived from data mining methods (Multilayer Perceptrons Neural Networks, Radial Basis Function Neural Networks, Support Vector Machines, CART, CHAID and QUEST Classification Trees and Random Forests) were compared to three traditional classifiers (Linear Discriminant Analysis, Quadratic Discriminant Analysis and Logistic Regression) in terms of overall classification accuracy, specificity, sensitivity, Area under the ROC curve and Press'Q. Model predictors were 10 neuropsychological tests currently used in the diagnosis of dementia. Statistical distributions of classification parameters obtained from a 5-fold cross-validation were compared using the Friedman's nonparametric test.
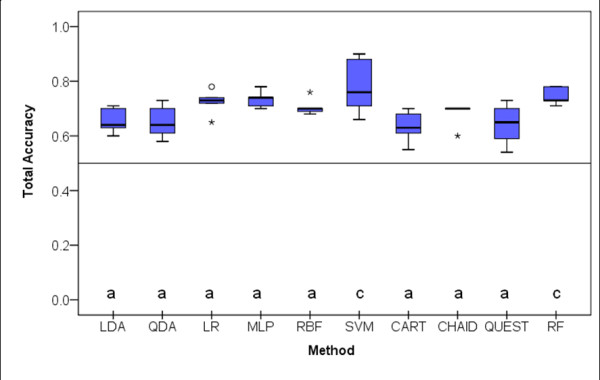
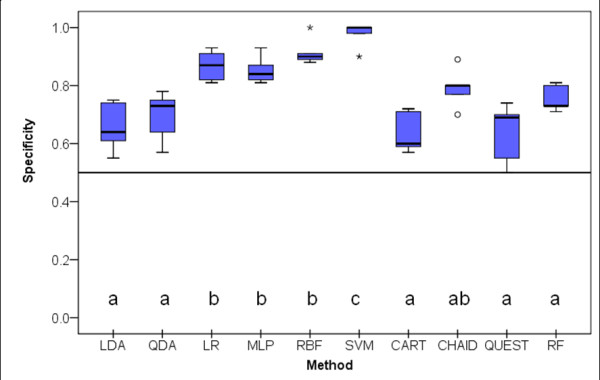
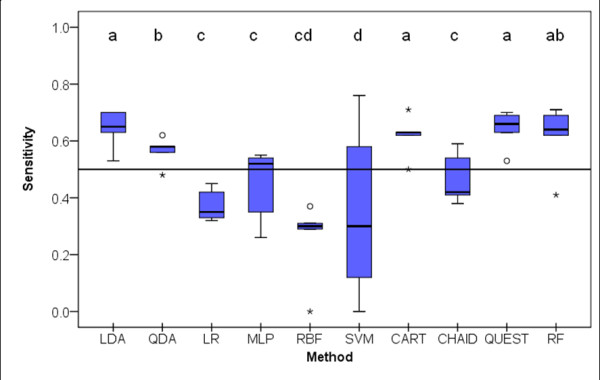
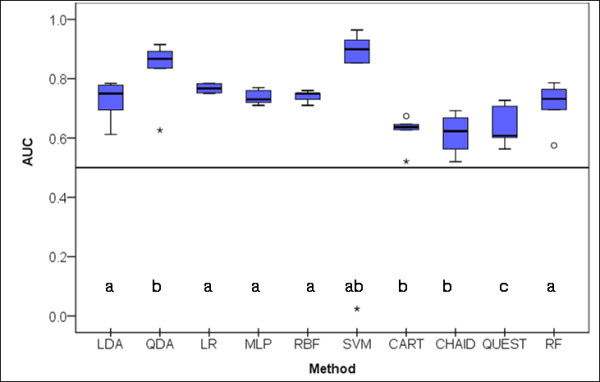
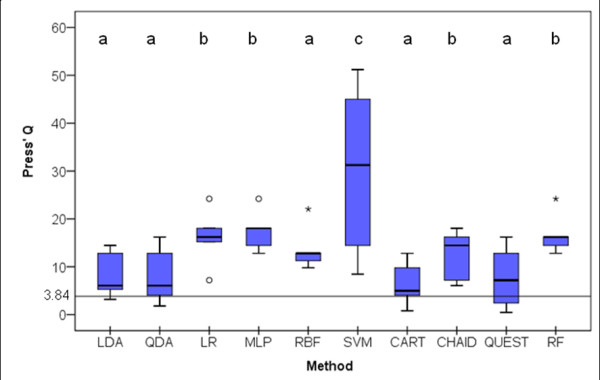
Results: Press' Q test showed that all classifiers performed better than chance alone (p < 0.05). Support Vector Machines showed the larger overall classification accuracy (Median (Me) = 0.76) an area under the ROC (Me = 0.90). However this method showed high specificity (Me = 1.0) but low sensitivity (Me = 0.3). Random Forest ranked second in overall accuracy (Me = 0.73) with high area under the ROC (Me = 0.73) specificity (Me = 0.73) and sensitivity (Me = 0.64). Linear Discriminant Analysis also showed acceptable overall accuracy (Me = 0.66), with acceptable area under the ROC (Me = 0.72) specificity (Me = 0.66) and sensitivity (Me = 0.64). The remaining classifiers showed overall classification accuracy above a median value of 0.63, but for most sensitivity was around or even lower than a median value of 0.5.
Conclusions: When taking into account sensitivity, specificity and overall classification accuracy Random Forests and Linear Discriminant analysis rank first among all the classifiers tested in prediction of dementia using several neuropsychological tests. These methods may be used to improve accuracy, sensitivity and specificity of Dementia predictions from neuropsychological testing.
Figures
Similar articles
-
Real-data comparison of data mining methods in prediction of diabetes in iran.Healthc Inform Res. 2013 Sep;19(3):177-85. doi: 10.4258/hir.2013.19.3.177. Epub 2013 Sep 30. Healthc Inform Res. 2013. PMID: 24175116 Free PMC article.
-
Discrimination between healthy participants and people with panic disorder based on polygenic scores for psychiatric disorders and for intermediate phenotypes using machine learning.Aust N Z J Psychiatry. 2024 Jul;58(7):603-614. doi: 10.1177/00048674241242936. Epub 2024 Apr 6. Aust N Z J Psychiatry. 2024. PMID: 38581251
-
Ensemble of random forests One vs. Rest classifiers for MCI and AD prediction using ANOVA cortical and subcortical feature selection and partial least squares.J Neurosci Methods. 2018 May 15;302:47-57. doi: 10.1016/j.jneumeth.2017.12.005. Epub 2017 Dec 11. J Neurosci Methods. 2018. PMID: 29242123
-
Machine learning model identification and prediction of patients' need for ICU admission: A systematic review.Am J Emerg Med. 2023 Nov;73:166-170. doi: 10.1016/j.ajem.2023.08.043. Epub 2023 Sep 4. Am J Emerg Med. 2023. PMID: 37696074 Review.
-
Machine and deep learning algorithms for classifying different types of dementia: A literature review.Appl Neuropsychol Adult. 2024 Aug 1:1-15. doi: 10.1080/23279095.2024.2382823. Online ahead of print. Appl Neuropsychol Adult. 2024. PMID: 39087520 Review.
Cited by
-
External Validation of Models for Predicting Disability in Community-Dwelling Older People in the Netherlands: A Comparative Study.Clin Interv Aging. 2023 Nov 14;18:1873-1882. doi: 10.2147/CIA.S428036. eCollection 2023. Clin Interv Aging. 2023. PMID: 38020449 Free PMC article.
-
Prediction of Prognostic Risk Factors in Patients with Invasive Candidiasis and Cancer: A Single-Centre Retrospective Study.Biomed Res Int. 2022 Jun 2;2022:7896218. doi: 10.1155/2022/7896218. eCollection 2022. Biomed Res Int. 2022. Retraction in: Biomed Res Int. 2024 Mar 20;2024:9797025. doi: 10.1155/2024/9797025. PMID: 35692595 Free PMC article. Retracted.
-
Prediction of acute kidney injury risk after cardiac surgery: using a hybrid machine learning algorithm.BMC Med Inform Decis Mak. 2022 May 18;22(1):137. doi: 10.1186/s12911-022-01859-w. BMC Med Inform Decis Mak. 2022. PMID: 35585624 Free PMC article.
-
Molecular mechanisms underlying striatal synaptic plasticity: relevance to chronic alcohol consumption and seeking.Eur J Neurosci. 2019 Mar;49(6):768-783. doi: 10.1111/ejn.13919. Epub 2018 Apr 20. Eur J Neurosci. 2019. PMID: 29602186 Free PMC article.
-
Clinical detection of deletion structural variants in whole-genome sequences.NPJ Genom Med. 2016 Aug 3;1:16026. doi: 10.1038/npjgenmed.2016.26. eCollection 2016. NPJ Genom Med. 2016. PMID: 29263817 Free PMC article.
References
-
- Petersen RC, Stevens JC, Ganguli M, Tangalos EG, Cummings JL, DeKosky ST. Practice parameter: Early detection of dementia: Mild cognitive impairment (an evidence-based review) - Report of the Quality Standards Subcommittee of the American Academy of Neurology. Neurology. 2001;56:1133–1142. - PubMed
-
- Portet F, Ousset PJ, Visser PJ, Frisoni GB, Nobili F, Scheltens P, Vellas B, Touchon J. Mild cognitive impairment (MCI) in medical practice: a critical review of the concept and new diagnostic procedure. Report of the MCI Working Group of the European Consortium on Alzheimer's Disease. J Neurol Neurosurg Psychiatry. 2006;77:714–718. doi: 10.1136/jnnp.2005.085332. - DOI - PMC - PubMed
-
- Dubois B, Feldman HH, Jacova C, Dekosky ST, Barberger-Gateau P, Cummings J, Delocourte A, Galasko D, Gauthier S, Jicha G. et al.Research criteria for the diagnosis of Alzheimer"s disease: revising the NINCDS-ADRDA criteria. Lancet Neurology. 2007;6:734–746. doi: 10.1016/S1474-4422(07)70178-3. - DOI - PubMed
LinkOut - more resources
Full Text Sources
Other Literature Sources
