. 2011 Aug 18:12:34.
doi: 10.1186/1471-2121-12-34.

Localization of chondromodulin-I at the feto-maternal interface and its inhibitory actions on trophoblast invasion in vitro

Affiliations

Localization of chondromodulin-I at the feto-maternal interface and its inhibitory actions on trophoblast invasion in vitro

Shigenori Miura et al. BMC Cell Biol. .

Abstract

Background: Chondromodulin-I (ChM-I) is an anti-angiogenic glycoprotein that is specifically localized at the extracellular matrix of the avascular mesenchyme including cartilage and cardiac valves. In this study, we characterized the expression pattern of ChM-I during early pregnancy in mice in vivo and its effect on invasion of trophoblastic cells into Matrigel in vitro.

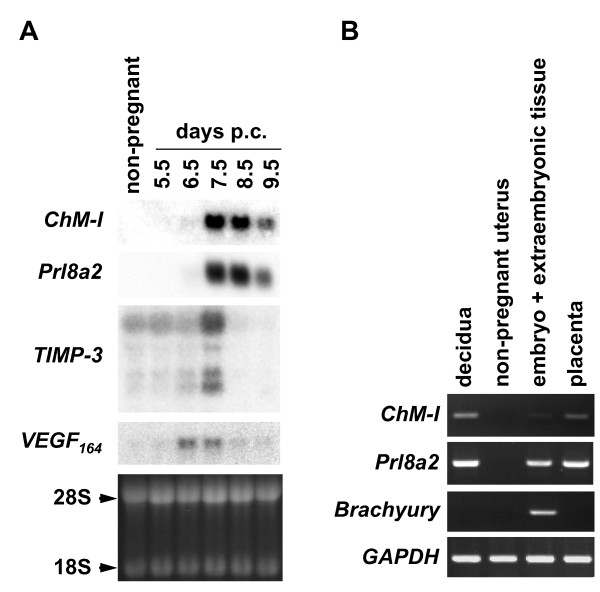
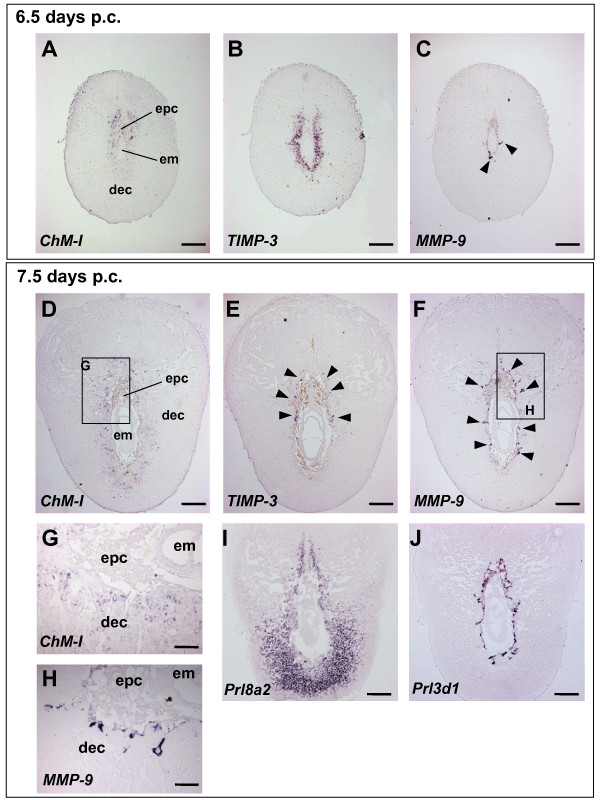
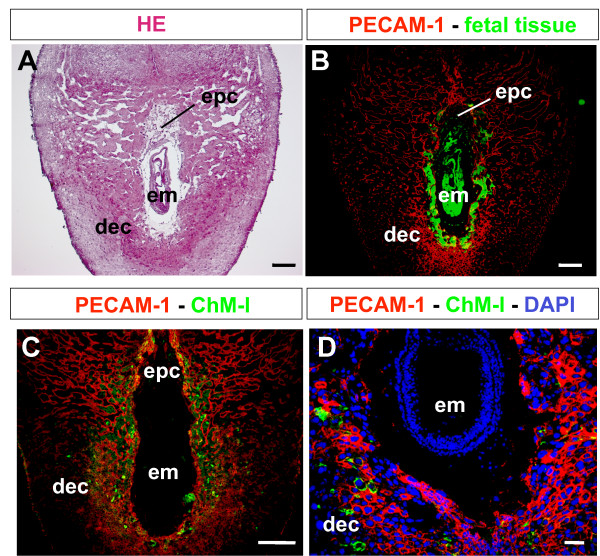
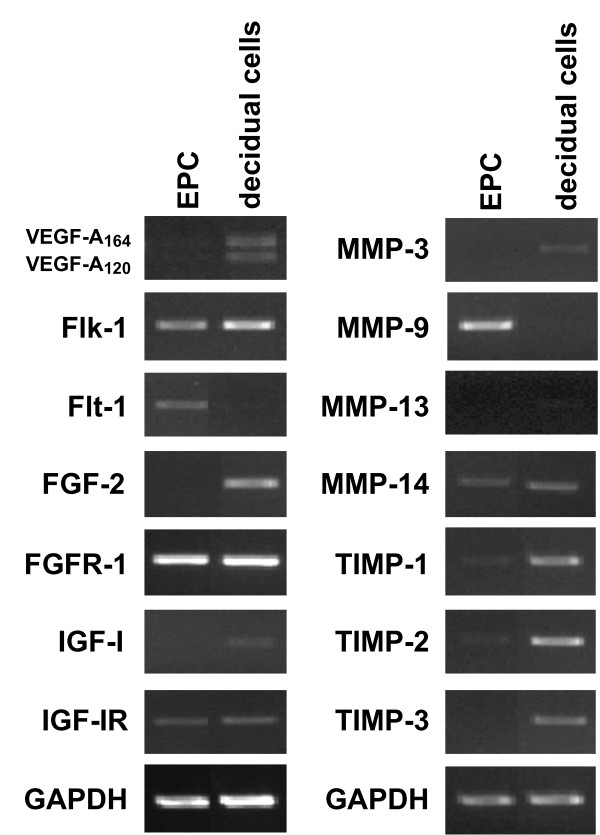
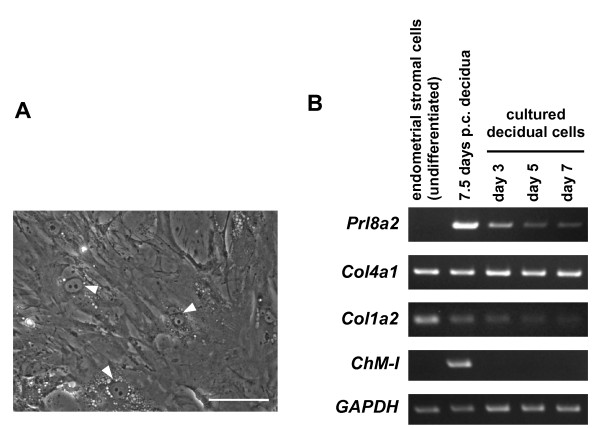
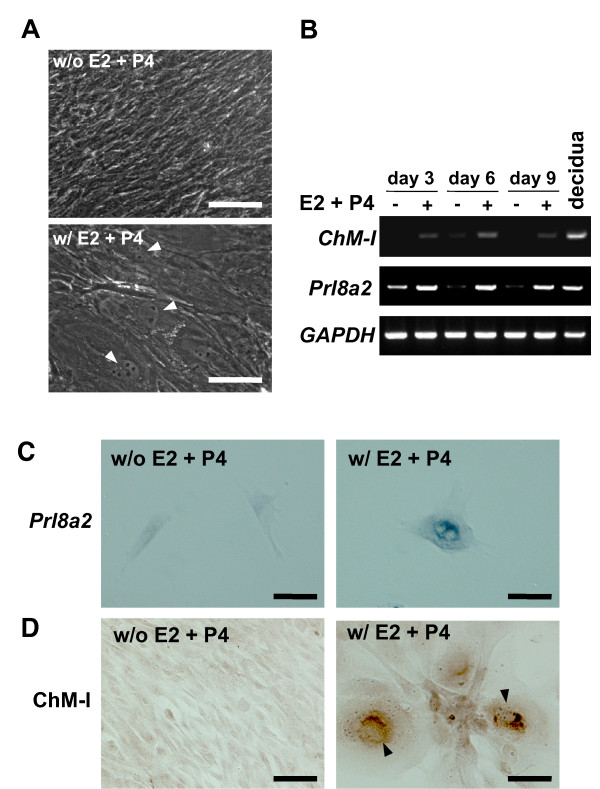
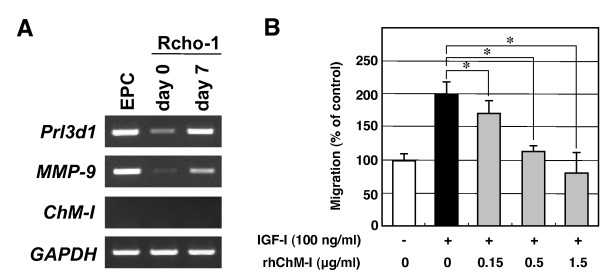
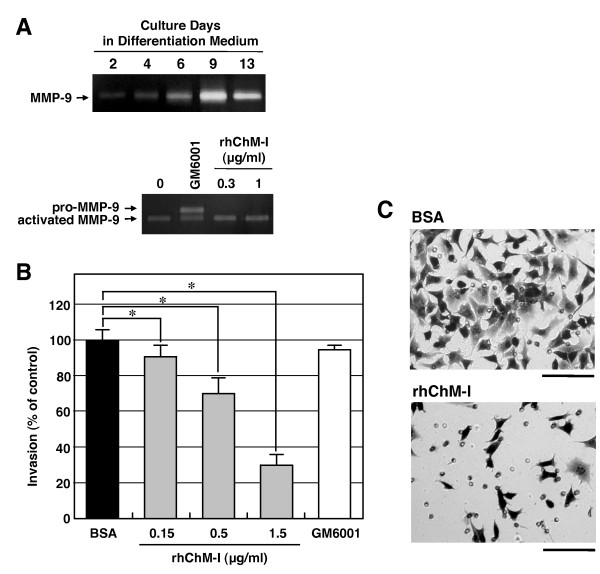
Results: Northern blot analysis clearly indicated that ChM-I transcripts were expressed in the pregnant mouse uterus at 6.5-9.5 days post coitum. In situ hybridization and immunohistochemistry revealed that ChM-I was localized to the mature decidua surrounding the matrix metalloproteinase-9 (MMP-9)-expressing trophoblasts. Consistent with this observation, the expression of ChM-I mRNA was induced in decidualizing endometrial stromal cells in vitro, in response to estradiol and progesterone. Recombinant human ChM-I (rhChM-I) markedly inhibited the invasion through Matrigel as well as the chemotactic migration of rat Rcho-1 trophoblast cells in a manner independent of MMP activation.

Conclusions: This study demonstrates the inhibitory action of ChM-I on trophoblast migration and invasion, implying the potential role of the ChM-I expression in decidual cells for the regulated tissue remodeling and angiogenesis at feto-maternal interface.


Figures

Figure 1
Figure 1
Expression of ChM-I in the mouse uterus during early pregnancy. (A) Northern blot analysis of ChM-I mRNA in the pregnant mouse uterus. Total RNA was extracted from pregnant mouse uteri (myometrium + decidua + embryo) and non-pregnant mouse uteri, separated on a denatured agarose gel, and transferred to a nylon membrane. The blots were then hybridized with a radio-labeled probe for ChM-I, Prl8a2, TIMP-3, and VEGF-A164, respectively. The equivalent loading of RNA (15 μg/lane) in each lane was verified by ethidium bromide staining. Arrowheads indicate the positions of the 28S and 18S ribosomal RNAs. (B) Total RNA was extracted from decidua (7.5 days p.c.), non-pregnant mouse uteri (8-week-old), embryos (7.5 days p.c., including extraembryonic tissues), and placenta (13.5 days p.c.). The decidual tissues were prepared by the removal of embryos and extraembryonic tissues from whole decidual capsules. One microgram of each total RNA preparation was reverse-transcribed, and the expression of ChM-I and marker genes (Prl8a2, a marker for trophoblasts and decidua; Brachyury, a marker for embryonic tissue) was analyzed by RT-PCR (30 cycles). GAPDH was used as an internal control. The data are representative of three independent experiments.
Figure 2
Figure 2
Localization of ChM-I transcripts in the decidua. Expression of ChM-I (A, D, and G), TIMP-3 (B and E), and MMP-9 (C, F, and H) transcripts analyzed by in situ hybridization using semi-serial sections of 6.5 (A-C) and 7.5 (D-F) days p.c. mouse decidual capsules. Expression of Prl8a2 (I) and Prl3d1 (a marker for trophoblasts; J) transcripts were also examined at 7.5 days p.c. Boxed areas in panels D and F are magnified in panels G and H, respectively. Note that, at 7.5 days p.c., ChM-I transcripts were broadly detectable in the primary decidua surrounding the implanting embryo and in MMP-9-positive cells (arrowheads in panel C and F), whilst TIMP-3 transcripts (arrowheads in panel E) were marginally detected at the mesometrial side. All images are representative of at least three independent experiments. epc, ectoplacental cone; em, embryo; dec, decidua. Bars in panels A-F and I-J, 300 μm; bars in panels G-H, 100 μm.
Figure 3
Figure 3
Localization of ChM-I protein in the decidua. (A and B) Visualization of invading fetal tissue through the decidua. Female mice were mated with homozygous EGFP transgenic male mice. At 7.5 days p.c., decidual capsules were dissected from the pregnant mice, fixed, and cryo-sectioned. Semi-serial sections were stained with HE (A) and anti-PECAM-1 antibodies (B, red), respectively. Fetal tissue (green) invading through the maternal decidua was observed under a fluorescence microscope. (C and D) Localization of ChM-I protein and PECAM-1-positive cells. Cryo-sections of 7.5 days p.c. tissues were double-immunostained with anti-ChM-I antibody (green) and anti-PECAM-1 antibody (red), and counterstained with DAPI (panel D). All images are representative of at least three independent experiments. epc, ectoplacental cone; em, embryo; dec, decidua. Bars in panels A-C, 200 μm; Bar in panel D, 50 μm.
Figure 4
Figure 4
Expression profiles of angiogenesis- and matrix remodeling-related genes in cultured EPCs and decidual cells. EPCs and decidual cells were isolated from decidual capsules at 7.5 days p.c. Decidual cells (5 × 10⁵ cells/well in 6-multiwell plates) and EPCs (10 EPCs/well in 6-multiwell plates) were cultured in DMEM containing 10% FBS for 2-5 days, respectively. Total RNA was isolated, reverse-transcribed, and the indicated sets of genes associated with angiogenesis (left panel) and tissue remodeling (right panel) were analyzed by RT-PCR (25 cycles for VEGF-A, Flk-1, Flt-1, MMP-3, MMP-9, MMP-14, TIMP-1, TIMP-2, TIMP-3; 30 cycles for FGF-2, FGFR-1, IGF-I, IGF-IR, MMP-1). GAPDH (25 cycles) was used as an internal control. The data are representative of three independent experiments.
Figure 5
Figure 5
Loss of ChM-I expression in cultured decidual cells. (A) Decidual cells were enzymatically isolated from decidual capsules (7.5 days p.c.) and seeded at 5 × 10⁵ cells/well in a 6-multiwell plate. The cells were then cultured for seven days in DMEM containing 10% FBS. Arrowheads indicate cells that have multiple- or enlarged nuclei, which are characteristic of the differentiated decidual cells. Bars, 100 μm. (B) Total RNA was isolated from decidual cell cultures at the indicated time points, endometrial stromal cells cultured for three days, and decidual tissue at 7.5 days p.c. One microgram of total RNA was reverse-transcribed, and the expression of ChM-I, Prl8a2, Col4a1, and Col1a2 was analyzed by RT-PCR (25 cycles for Prl8a2, Col4a1, Col1a2; 35 cycles for ChM-I). The data are representative of three independent experiments.
Figure 6
Figure 6
Induction of ChM-I expression during the decidualization of mouse endometrial stromal cells in vitro. Mouse endometrial stromal cells were enzymatically isolated from the uteri of 4 week-old non-pregnant mice and cultured in medium containing 10% charcoal-stripped FBS. The in vitro decidualization of endometrial stromal cells was induced by the addition of E2 (0.1 nM) and P4 (100 nM) to the culture media. (A) Representative microphotographs of the endometrial stromal cells cultured for nine days in the presence (lower panel) or absence (upper panel) of E2 + P4. Arrowheads indicate enlarged or multi-nucleated cells that are characteristic of decidual cells. Bars, 50 μm. (B) Expression of ChM-I and Prl8a2 in decidualized cultures of endometrial stromal cells. Total RNA was extracted from the cells at the indicated time points and from mouse decidua (7.5 days p.c.). One microgram of each total RNA preparation was reverse-transcribed and analyzed by RT-PCR (35 cycles) for comparison. GAPDH was used as an internal control. (C, D) Expression of Prl8a2 gene in decidualized cells and immunostaining of ChM-I protein. The endometrial stromal cells were cultured for six days with or without E2 + P4, fixed, and subjected to in situ hybridization for Prl8a2 (C) and immunostaining with anti-ChM-I antibody (D). Note that intense signals for ChM-I protein (arrowheads) were observed in enlarged cells that also expressed Prl8a2. Bars, 30 μm. All images are representative of three independent experiments.
Figure 7
Figure 7
Effects of rhChM-I on the IGF-I-induced migration of Rcho-1 trophoblast cells. (A) Expression of Prl3d1, MMP-9, and ChM-I in Rcho-1 trophoblast cells. Rcho-1 trophoblast cells were seeded at 2 × 10⁵ cells/well in 6-multiwell plates and cultured in growth medium (NCTC-135 medium containing 20% FBS) until reaching confluence (day 0; undifferentiated). The culture medium was then replaced with differentiation medium (NCTC-135 medium containing 10% horse serum), and the cells were cultured for seven days (day 7, differentiated) to promote their differentiation to trophoblast giant cells. EPCs were isolated at 7.5 days p.c. and cultured for two days in DMEM containing 10% FBS and 15 mM HEPES. Total RNA was then isolated and reverse-transcribed, and the expression of Prl3d1 (28 cycles), MMP-9 (28 cycles), and ChM-I (35 cycles) was analyzed by RT-PCR. GAPDH (28 cycles) was used as an internal control. The gel images are representative of three independent experiments. (B) Boyden chamber migration assay of Rcho-1 trophoblast cells. Serum-starved Rcho-1 trophoblast cells (1 × 10⁵ cells/200 μl) were preincubated with or without rhChM-I for 20 min, and then seeded onto fibronectin-coated cell culture inserts in NCTC-135 medium containing 0.5% FBS. Chemotactic migration of Rcho-1 cells was induced by the addition of IGF-I (100 ng/ml) to the lower chamber. Cells were then allowed to migrate for 6 h in the presence of various concentrations of rhChM-I. Control cells were treated with 0.1% BSA/PBS and allowed to migrate in the absence of IGF-I. The number of cells that had invaded the undersurface of the insert was counted in five representative high power fields (under × 200 magnification) per insert. The values shown are percentages of the number of migrated cells compared with the control cells (22 ± 2.3 cells/field) and are the means ± SD of a triplicate assay. The data are representative of three independent experiments. The statistical significances were determined by the Student's t-tests as compared to IGF-I alone (*P < 0.05, one-tailed).
Figure 8
Figure 8
Effects of rhChM-I on the invasion of Rcho-1 trophoblast cells. (A) Effects of rhChM-I on the production and activation of MMP-9 in cultures of Rcho-1 trophoblast cells. Cells were grown to confluence, and the culture medium was then replaced with differentiation medium (NCTC-135 medium containing 10% horse serum). At the indicated time points (at day 2, 4, 6, 9, and 13), the culture medium was changed to medium containing 1% horse serum and conditioned for 24 h. The gelatinolytic activity in the conditioned medium was analyzed by gelatin zymography (upper panel). rhChM-I or GM6001 (25 μM) was added to cultures of Rcho-1 trophoblast cells in differentiation medium on day 9, and the cells were incubated another for 24 h in medium containing 1% horse serum. The gelatinolytic activity in the conditioned medium was then analyzed by gelatin zymography (lower panel). The gel images are representative of three independent experiments. (B) Matrigel invasion assay of Rcho-1 cells. Subconfluent Rcho-1 trophoblast cells were harvested and resuspended in NCTC-135 medium containing 0.5% horse serum, and seeded onto cell culture inserts (5 × 10⁴ cells/200 μl) coated with a layer of Matrigel. The cells were allowed to invade for 16 h in the presence of 0.1% BSA/PBS (control), various concentrations of rhChM-I, or GM6001 (25 μM) in NCTC-135 medium containing 0.5% horse serum. The number of cells that had invaded the undersurface of the insert was counted under × 200 magnification. The values shown are percentages of the number of invading cells compared with the control cells (361 ± 20.7 cells/field) and are the means ± SD of a triplicate assay. The data are representative of three independent experiments with similar results. The statistical significances were determined by the Student's t-tests as compared to the control (0.1%BSA/PBS) (*P < 0.05, one-tailed). (C) Representative microphotographs of Rcho-1 trophoblast cells that had invaded the bottom surface of the insert in the presence of 0.1% BSA/PBS (upper panel, control) or 1.5 μg/ml rhChM-I (lower panel). Bars, 100 μm.

Similar articles

Cited by

References

    1. Funaki H, Sawaguchi S, Yaoeda K, Koyama Y, Yaoita E, Funaki S, Shirakashi M, Oshima Y, Shukunami C, Hiraki Y. et al.Expression and localization of angiogenic inhibitory factor, chondromodulin-I, in adult rat eye. Invest Ophthalmol Vis Sci. 2001;42(6):1193–1200. - PubMed
    1. Yoshioka M, Yuasa S, Matsumura K, Kimura K, Shiomi T, Kimura N, Shukunami C, Okada Y, Mukai M, Shin H. et al.Chondromodulin-I maintains cardiac valvular function by preventing angiogenesis. Nat Med. 2006;12(10):1151–1159. doi: 10.1038/nm1476. - DOI - PubMed
    1. Shukunami C, Takimoto A, Miura S, Nishizaki Y, Hiraki Y. Chondromodulin-I and tenomodulin are differentially expressed in the avascular mesenchyme during mouse and chick development. Cell Tissue Res. 2008;332(1):111–122. doi: 10.1007/s00441-007-0570-8. - DOI - PubMed
    1. Hiraki Y, Inoue H, Iyama K, Kamizono A, Ochiai M, Shukunami C, Iijima S, Suzuki F, Kondo J. Identification of chondromodulin I as a novel endothelial cell growth inhibitor. Purification and its localization in the avascular zone of epiphyseal cartilage. J Biol Chem. 1997;272(51):32419–32426. doi: 10.1074/jbc.272.51.32419. - DOI - PubMed
    1. Hiraki Y, Kono T, Sato M, Shukunami C, Kondo J. Inhibition of DNA synthesis and tube morphogenesis of cultured vascular endothelial cells by chondromodulin-I. FEBS Lett. 1997;415(3):321–324. doi: 10.1016/S0014-5793(97)01151-4. - DOI - PubMed

Publication types

MeSH terms