. 2011 Sep 14;52(10):7222-31.
doi: 10.1167/iovs.11-7856.

Effects of brief daily periods of unrestricted vision during early monocular form deprivation on development of visual area 2

Affiliations

Effects of brief daily periods of unrestricted vision during early monocular form deprivation on development of visual area 2

Bin Zhang et al. Invest Ophthalmol Vis Sci. .

Abstract

Purpose: Providing brief daily periods of unrestricted vision during early monocular form deprivation reduces the depth of amblyopia. To gain insights into the neural basis of the beneficial effects of this treatment, the binocular and monocular response properties of neurons were quantitatively analyzed in visual area 2 (V2) of form-deprived macaque monkeys.

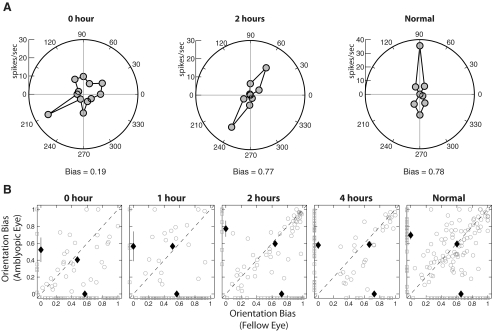
Methods: Beginning at 3 weeks of age, infant monkeys were deprived of clear vision in one eye for 12 hours every day until 21 weeks of age. They received daily periods of unrestricted vision for 0, 1, 2, or 4 hours during the form-deprivation period. After behavioral testing to measure the depth of the resulting amblyopia, microelectrode-recording experiments were conducted in V2.

Results: The ocular dominance imbalance away from the affected eye was reduced in the experimental monkeys and was generally proportional to the reduction in the depth of amblyopia in individual monkeys. There were no interocular differences in the spatial properties of V2 neurons in any subject group. However, the binocular disparity sensitivity of V2 neurons was significantly higher and binocular suppression was lower in monkeys that had unrestricted vision.

Conclusions: The decrease in ocular dominance imbalance in V2 was the neuronal change most closely associated with the observed reduction in the depth of amblyopia. The results suggest that the degree to which extrastriate neurons can maintain functional connections with the deprived eye (i.e., reducing undersampling for the affected eye) is the most significant factor associated with the beneficial effects of brief periods of unrestricted vision.


Figures

Figure 1.
Figure 1.
Effects of the duration of brief daily periods of unrestricted vision during early monocular form deprivation on the depth of amblyopia. AIs of individual monkeys were plotted as a function of the duration of unrestricted vision (middle panel). Spatial contrast sensitivity functions for the deprived eye (filled circles) and the fellow eye (open circles) are also illustrated for the representative monkeys for each treatment group (top and bottom panels).
Figure 2.
Figure 2.
Effects of the duration of brief daily periods of unrestricted vision on the ocular dominance of V2 neurons. (A) Ocular dominance distribution for each treatment group. ROII values calculated for each group are shown. A, amblyopic eye. F, fellow eye. (B) The average AI as a function of rearing histories for each group (r = 0.96, P = 0.03).
Figure 3.
Figure 3.
Effects of the duration of brief daily periods of unrestricted vision on the orientation bias of V2 neurons. (A) Representative orientation-tuning functions for the affected eye from a monkey reared with continuous form deprivation (0 hours of unrestricted vision) (left), a deprived monkey with 2 hours of unrestricted vision (middle), and a normal monkey (right). (B) Interocular comparisons of the orientation biases of binocular units (ODI = 0.2–0.8; open circles). Filled symbols: mean values (±SE). Open squares on the x- and y-axes indicate comparable data for monocular units (ODI = 0.0–0.2 or 0.8–1.0). Filled symbols on the x- and y-axes show the mean values (±SE) for monocular units and filled symbols near the unity line indicate the mean values (±SE) for binocular units. If error bars are not visible, the standard errors are smaller than the size (length and width) of the symbols.
Figure 4.
Figure 4.
Effects of the duration of brief daily periods of unrestricted vision on the spatial frequency tuning of V2 neurons. (A) Representative spatial frequency tuning functions for the affected eye from a monkey reared with continuous form deprivation (0 hours of unrestricted vision) (left), a deprived monkey with 2 hours of unrestricted vision (middle), and a normal monkey (right). (B) Interocular comparisons of the optimal spatial frequency of binocular units (ODI = 0.2–0.8) (open circles). Filled symbols: mean values (±SE). Open squares: on x- and y-axes indicate comparable data for monocular units (ODI = 0.0–0.2 or 0.8–1.0). Filled symbols along x- and y-axes show the mean values (±SE) for monocular units and filled symbols near the unity line indicate the mean values (±SE) for binocular units. If error bars are not visible, the standard errors are smaller than the size (length and width) of the symbols.
Figure 5.
Figure 5.
Effects of the duration of brief daily periods of unrestricted vision on binocular signal interactions in V2 neurons. (A) Representative binocular disparity sensitivity functions of a V2 neuron from a monkey reared with continuous form deprivation (left), a monocularly form deprived monkey with 2 hours of unrestricted vision (middle), and a normal monkey (right). BII, binocular interaction index. Dotted line with an open triangle indicates the response level of the dominant eye. Open triangle at the bottom right indicates the response level of the nondominant eye. Open square: the noise level (spontaneous firing). (B) Average (±SE) BII values for each subject group. (C) Average (±SE) peak B/M values for each group. (D) Proportion of binocularly suppressive units (peak B/M < 0.0 dB).
Figure 6.
Figure 6.
Comparisons of the relative magnitude of V2 (left) and V1 (right) deficits with the depth of amblyopia (AI). The ocular imbalance (ROII), the proportion of the binocularly suppressive unit, the average orientation bias, and the average optimal spatial frequency of neurons in individual monkeys were first normalized to the respective maximum value and then were fit to obtain a regression line for each cortical deficit. The slope (±SE) is given for each function.

References

    1. Chino YM. Developmental visual deprivation. In: Kaufman PL, Alm A. eds. Adler's Physiology of the Eye. Edinburgh: Elsevier; 2011:732–749
    1. Chino YM, Bi H, Zhang B. The postnatal development of the neuronal response properties in primate visual cortex. In: Kaas J, Collins C. eds. Primate Vision. Boca Raton, FL; 2004:81–108
    1. Kiorpes L, Movshon JA. Neural limitations on visual development in primates. In: Chalupa LM, Werner JS. eds. The Visual Neurosciences. Cambridge, MA: MIT Press; 2003:159–173
    1. Anderson SJ, Swettenham JB. Neuroimaging in human amblyopia. Strabismus. 2006;14:21–35 - PubMed
    1. Daw NW. Visual Development. 3rd ed New York: Springer; 2006

Publication types