. 2011 Oct;22(19):3595-608.
doi: 10.1091/mbc.E11-04-0340. Epub 2011 Aug 17.

A phosphatase threshold sets the level of Cdk1 activity in early mitosis in budding yeast

Affiliations

A phosphatase threshold sets the level of Cdk1 activity in early mitosis in budding yeast

Stacy L Harvey et al. Mol Biol Cell. 2011 Oct.

Abstract

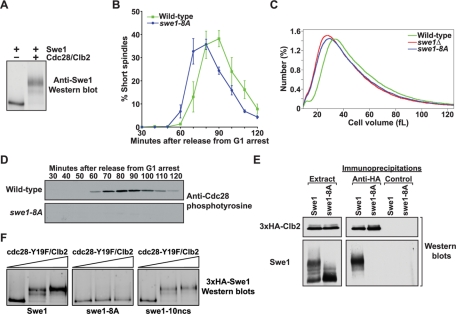
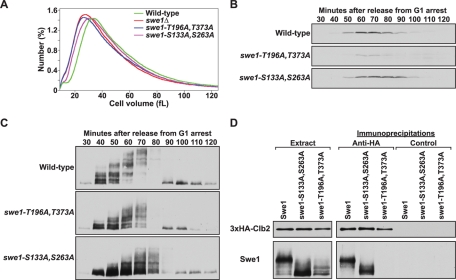
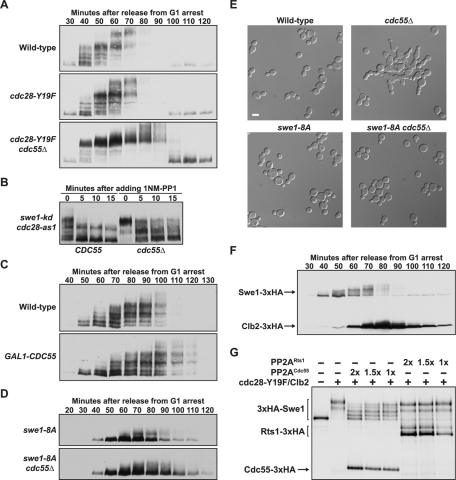
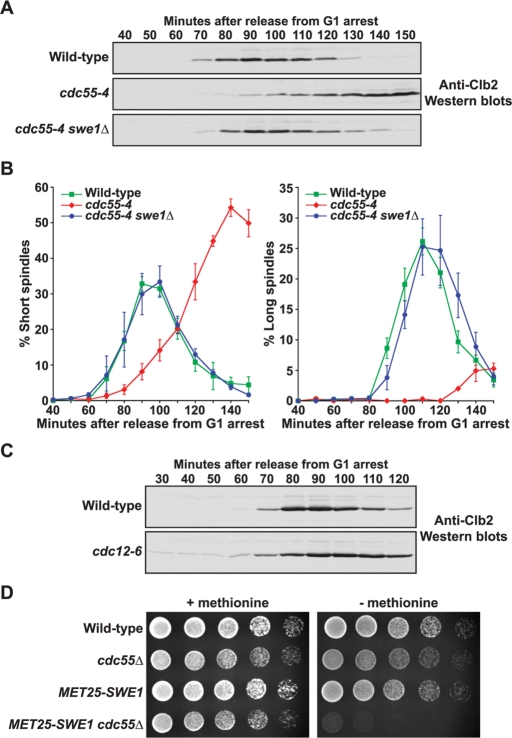
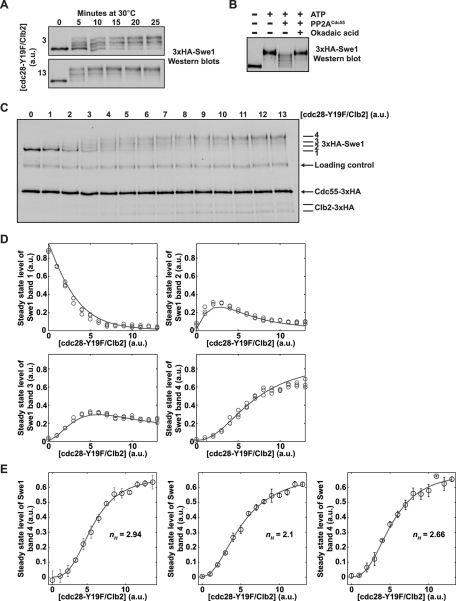
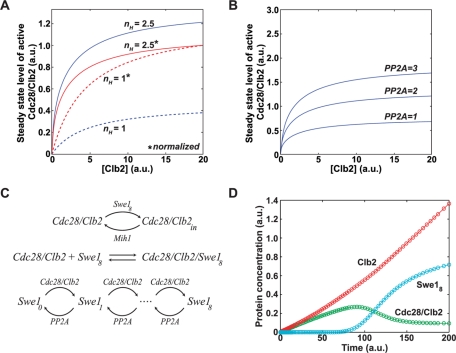
Entry into mitosis is initiated by synthesis of cyclins, which bind and activate cyclin-dependent kinase 1 (Cdk1). Cyclin synthesis is gradual, yet activation of Cdk1 occurs in a stepwise manner: a low level of Cdk1 activity is initially generated that triggers early mitotic events, which is followed by full activation of Cdk1. Little is known about how stepwise activation of Cdk1 is achieved. A key regulator of Cdk1 is the Wee1 kinase, which phosphorylates and inhibits Cdk1. Wee1 and Cdk1 show mutual regulation: Cdk1 phosphorylates Wee1, which activates Wee1 to inhibit Cdk1. Further phosphorylation events inactivate Wee1. We discovered that a specific form of protein phosphatase 2A (PP2A(Cdc55)) opposes the initial phosphorylation of Wee1 by Cdk1. In vivo analysis, in vitro reconstitution, and mathematical modeling suggest that PP2A(Cdc55) sets a threshold that limits activation of Wee1, thereby allowing a low constant level of Cdk1 activity to escape Wee1 inhibition in early mitosis. These results define a new role for PP2A(Cdc55) and reveal a systems-level mechanism by which dynamically opposed kinase and phosphatase activities can modulate signal strength.


Figures

FIGURE 1:
FIGURE 1:
Phosphorylation of Cdc28 consensus sites is necessary for Swe1 activity in vivo. (A) Purified Cdc28/Clb2 quantitatively phosphorylates purified Swe1 in vitro. Phosphorylation of Swe1 causes an electrophoretic mobility shift that is detected by Western blot analysis. (B) Wild-type and swe1-8A cells were released from a G1 arrest, and the percentage of cells with short mitotic spindles was determined at the indicated times and plotted as a function of time. Error bars represent SEM for three independent experiments. (C) Cell size distributions of log-phase cultures of wild-type, swe1Δ, and swe1-8A strains. Each trace is the average of 15 independent cultures. (D) Cells of the indicated genotypes were released from a G1 arrest, and samples were taken at the indicated times. Cdc28 phosphotyrosine was monitored by Western blotting. (E) Wild-type and swe1-8A cells carrying GAL1-3×HA-CLB2 were grown to midlog phase, and expression of 3×HA-Clb2 was induced with 2% galactose for 3 h at 30°C. Extracts were made, and 3×HA-Clb2 was immunoprecipitated with an anti-HA antibody. As a control, identical precipitations were carried out using an anti-GST antibody. Coprecipitation of Swe1 was assayed by Western blotting. The panels labeled “Extract” show Western blots of 3×HA-Clb2 and Swe1 in the crude extracts used for the immunoprecipitations. (F) Purified 3×HA-Swe1, 3×HA-swe1-8A, or 3×HA-swe1-10ncs were incubated with increasing amounts of purified cdc28-Y19F/Clb2-3×HA in the presence of ATP. Phosphorylation of Swe1 was detected as an electrophoretic mobility shift on a Western blot.
FIGURE 2:
FIGURE 2:
Analysis of Swe1 phosphorylation site mutants. (A) Cell size distributions of log-phase cultures of wild-type, swe1Δ, swe1-T196A,T373A, and swe1-S133A,S263A. Each trace is the average of 15 independent cultures. The wild-type and swe1Δ traces plotted in Figure 1C and panel A are identical. (B and C) Cells of the indicated genotypes were released from a G1 arrest into 30°C YPDA medium and samples were taken at the indicated times. The behavior of (B) Cdc28 phosphotyrosine and (C) Swe1 was assayed by Western blotting. (D) Wild-type, swe1-S133A,S263A, and swe1-T196A,T373A cells carrying GAL1-3×HA-CLB2 were grown to midlog phase and expression of 3×HA-Clb2 was induced with 2% galactose for 3 h at 30°C. Extracts were made and 3×HA-Clb2 was immunoprecipitated with an anti-HA antibody. As a control, identical precipitations were carried out using an anti-GST antibody. Coprecipitation of Swe1 was assayed by Western blotting.
FIGURE 3:
FIGURE 3:
PP2ACdc55 opposes the initial phosphorylation of Swe1 by Cdc28. (A) Cells of the indicated genotypes were released from G1 arrest, and the behavior of Swe1 was assayed by Western blotting. The strains used for this experiment were generated in the A364A background. Similar results were obtained in the W303-1A strain background. (B) 1NM-PP1 was added to cdc28-as1 swe1-kd or cdc28-as1 swe1-kd cdc55Δ cells 65 min after release from G1 arrest. Swe1 phosphorylation was assayed by Western blotting. (C) Cells were grown overnight in YEP medium containing 2% raffinose, and then arrested with α-factor at room temperature. After a 2-h incubation in the presence of α-factor, 2% galactose was added to initiate expression of GAL1-CDC55, and the incubation was continued for an additional 1 h. Cells were released from the arrest into galactose-containing YEP medium, and the behavior of Swe1 was assayed by Western blotting. (D) Cells of the indicated genotypes were released from G1 arrest into 30°C YPD medium, and the behavior of Swe1 was assayed by Western blotting. (E) Cells of the indicated genotypes were grown overnight to log phase at room temperature in YPD medium and imaged by differential interference contrast microscopy. Scale bar: 5 μm. (F) Cells carrying Clb2-3×HA and Swe1-3×HA were released from a G1 arrest into 30°C YPD medium, and the behavior of Clb2 and Swe1 was monitored on the same Western blot. (G) The indicated combinations of purified protein complexes were incubated in the presence of ATP and purified dephosphorylated Swe1 for 20 min, and then analyzed by Western blotting. All of the 3×HA-tagged proteins were detected on the same blot with an anti-HA antibody. Three different concentrations of PP2ACdc55 or PP2ARts1 that varied over a twofold range (indicated as 1×, 1.5×, and 2×) were added to the reactions.
FIGURE 4:
FIGURE 4:
Inactivation of PP2ACdc55 causes a Swe1-dependent delay in Clb2 accumulation. (A and B) Cells of the indicated genotypes were released from G1 arrest into 35°C YPD medium. Samples were taken every 10 min at the indicated times. (A) Clb2 protein levels were monitored by Western blotting. (B) The percentage of cells with short or long spindles was determined and plotted as a function of time. Error bars represent SEM for three independent experiments. (C) Cells of the indicated genotypes were grown overnight to log phase, and then arrested with α-factor for 4 h at 20°C. Cells were released from the G1 arrest into 37°C YPD medium. Samples were taken every 10 min at the indicated times, and Clb2 protein levels were monitored by Western blotting. (D) Fivefold serial dilutions of cells of the indicated genotypes were grown on minimal media plates containing 2% dextrose in the presence or absence of 20 μg/ml l-methionine at 30°C. The MET25 promoter is induced in the absence of l-methionine.
FIGURE 5:
FIGURE 5:
The response of Swe1 to rising levels of cdc28-Y19F/Clb2 is ultrasensitive. (A) Reactions containing Swe1, PP2ACdc55, and two concentrations of cdc28-Y19F/Clb2 were initiated by addition of ATP. Samples were taken at the indicated times, and the phosphorylation state of Swe1 was assayed by Western blotting. The amounts of cdc28-Y19F/Clb2 were chosen to demonstrate that the reactions carried out in (C) approach steady state within the reaction time at both low and high concentrations of cdc28-Y19F/Clb2 (a.u., arbitrary units). (B) Reactions containing Swe1 and cdc28-Y19F/Clb2 were incubated for 15 min in the presence or absence of ATP and PP2ACdc55 (lanes 1–3). Samples were taken from each reaction, and okadaic acid was then added to the reaction in lane 3, which was incubated for an additional 10 min before taking a sample (lane 4). Swe1 phosphorylation was assayed by Western blotting. (C) Phosphorylation of Swe1 (bands labeled 1–4) as a function of cdc28-Y19F/Clb2 concentration in the presence of a constant amount of PP2ACdc55. Reactions were allowed to proceed for 20 min. Alexa Fluor 647–labeled phosphorylase B was used as a loading control. Proteins were assayed by quantitative Western blotting using a monoclonal HA antibody to detect each 3×HA-tagged protein. (D) Quantitation of the amount of each Swe1 band generated in the reactions shown in (C). Reactions were analyzed in triplicate; circles represent data from each of the three replicates. Each graph also shows a line that represents the solution of the pipeline model described in the Supplemental Information. (E) Swe1 shows an ultrasensitive response to rising levels of cdc28-Y19F/Clb2. We repeated the analysis using three independent preparations of purified cdc28-Y19F/Clb2 and two independent preparations of PP2ACdc55 to create three biological replicates of the steady-state analysis, and each biological replicate was measured in triplicate. The graphs show the average quantitation of the amount of Swe1 band 4 generated as a function of cdc28-Y19F/Clb2 concentration for each biological replicate. Error bars represent SD. In each graph, a Hill function was fit through least-squares approximation, and the Hill coefficients (nH) are displayed.
FIGURE 6:
FIGURE 6:
Systems-level regulation of Cdc28 and Swe1 by PP2ACdc55 in early mitosis. (A) The steady-state activity of Cdc28/Clb2 was calculated by intersecting the dose–response curves in Figure S7, A–B, and the resulting values were plotted for different Clb2 concentrations. The solid and dotted lines were determined using the solid and dotted lines in Figure S7A (see Supplemental Information for details, including parameter values; a.u., arbitrary units). The red lines show plots in which the final level of Cdc28/Clb2 activity was normalized to 1 to emphasize the different shapes of the curves. The blue lines show plots that were not normalized, which indicate the different levels of Cdc28/Clb2 activity achieved under each condition. (B) Using the response curve for nH = 2.5 in (A), the same graph as in (A) is plotted for increasing PP2ACdc55 concentrations. (C and D) A detailed quantitative model of the interactions among Swe1, Clb2, Cdc28, and PP2ACdc55 during entry into mitosis. (C) The chemical reactions that define the network, using mass-action terms for each interaction. (D) A sample time course of the model, set in motion by a steadily increasing Clb2 concentration. The red line shows rising Clb2 levels, the green line shows Cdc28/Clb2 activity, and the blue line shows Swe1 activity.

References

    1. Amon A, Tyers M, Futcher B, Nasmyth K. Mechanisms that help the yeast cell cycle clock tick: G2 cyclins transcriptionally activate G2 cyclins and repress G1 cyclins. Cell. 1993;74:993–1007. - PubMed
    1. Bakalarski CE, Elias JE, Villén J, Haas W, Gerber SA, Everley PA, Gygi SP. The impact of peptide abundance and dynamic range on stable-isotope-based quantitative proteomic analyses. J Proteome Res. 2008;7:4756–4765. - PMC - PubMed
    1. Carroll C, Altman R, Schieltz D, Yates J, Kellogg DR. The septins are required for the mitosis-specific activation of the Gin4 kinase. J Cell Biol. 1998;143:709–717. - PMC - PubMed
    1. Castilho PV, Williams BC, Mochida S, Zhao Y, Goldberg ML. The M phase kinase Greatwall (Gwl) promotes inactivation of PP2A/B55δ, a phosphatase directed against CDK phosphosites. Mol Biol Cell. 2009;20:4777–4789. - PMC - PubMed
    1. Chiroli E, Rossio V, Lucchini G, Piatti S. The budding yeast PP2ACdc55 protein phosphatase prevents the onset of anaphase in response to morphogenetic defects. J Cell Biol. 2007;177:599–611. - PMC - PubMed

Publication types

MeSH terms