. 2011 Oct 14;286(41):35650-35662.
doi: 10.1074/jbc.M111.262733. Epub 2011 Aug 17.

Group V phospholipase A2 in bone marrow-derived myeloid cells and bronchial epithelial cells promotes bacterial clearance after Escherichia coli pneumonia

Affiliations

Group V phospholipase A2 in bone marrow-derived myeloid cells and bronchial epithelial cells promotes bacterial clearance after Escherichia coli pneumonia

Norbert Degousee et al. J Biol Chem. .

Abstract

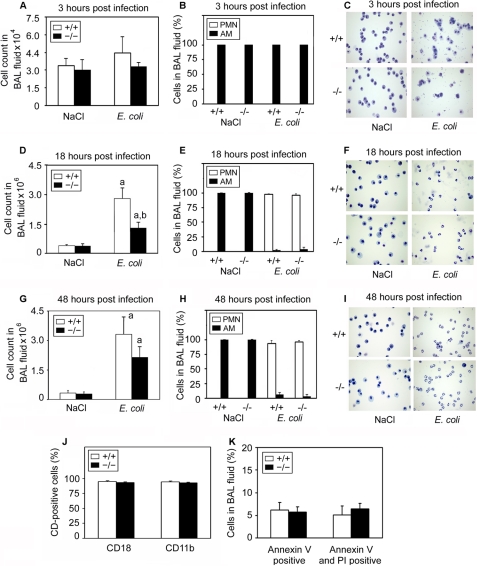
Group V-secreted phospholipase A(2) (GV sPLA(2)) hydrolyzes bacterial phospholipids and initiates eicosanoid biosynthesis. Here, we elucidate the role of GV sPLA(2) in the pathophysiology of Escherichia coli pneumonia. Inflammatory cells and bronchial epithelial cells both express GV sPLA(2) after pulmonary E. coli infection. GV(-/-) mice accumulate fewer polymorphonuclear leukocytes in alveoli, have higher levels of E. coli in bronchoalveolar lavage fluid and lung, and develop respiratory acidosis, more severe hypothermia, and higher IL-6, IL-10, and TNF-α levels than GV(+/+) mice after pulmonary E. coli infection. Eicosanoid levels in bronchoalveolar lavage are similar in GV(+/+) and GV(-/-) mice after lung E. coli infection. In contrast, GV(+/+) mice have higher levels of prostaglandin D(2) (PGD(2)), PGF(2α), and 15-keto-PGE(2) in lung and express higher levels of ICAM-1 and PECAM-1 on pulmonary endothelial cells than GV(-/-) mice after lung infection with E. coli. Selective deletion of GV sPLA(2) in non-myeloid cells impairs leukocyte accumulation after pulmonary E. coli infection, and lack of GV sPLA(2) in either bone marrow-derived myeloid cells or non-myeloid cells attenuates E. coli clearance from the alveolar space and the lung parenchyma. These observations show that GV sPLA(2) in bone marrow-derived myeloid cells as well as non-myeloid cells, which are likely bronchial epithelial cells, participate in the regulation of the innate immune response to pulmonary infection with E. coli.


Figures

FIGURE 1.
FIGURE 1.
Impaired bacterial clearance in GV−/− mice after pulmonary E. coli infection. Shown are bacterial levels in BAL fluid 3 h (BALF, A), 18 h (C), and 48 h (E) after injection of 109 cfu of E. coli into the trachea of GV+/+ (open bars) and GV−/− (filled bars) mice and in lung (after BAL fluid harvest) 3 h (B), 18 h (D), and 48 h (F) after the same injection. PLA2 activity in BAL fluid (G) and bacterial killing after co-incubation of live E. coli with recombinant mouse GV sPLA2 in vitro (H) are shown. The mean specific PLA2 activity for recombinant mouse GV (mGV) sPLA2 was measured at 3.2 ± 0.5 units/ng. a, p < 0.05, E. coli versus NaCl; b, p < 0.05, GV+/+ versus GV−/−, ANOVA followed by paired t tests, 2-tailed, unequal variance, serial dilution culture, n ≥ 20 per group.
FIGURE 2.
FIGURE 2.
GV sPLA2 is expressed in inflammatory cells and in bronchial epithelial cells after pulmonary E. coli infection. Immunohistochemical analysis (×400) with rabbit anti-mouse GV sPLA2 antiserum before (A) and 18 h after intra-tracheal injection of 109 cfu of E. coli (B) into GV+/+ and GV−/− mice. C, shown is a magnified view (×1000) of the boxed-in areas shown in panel B. Short arrowheads identify leukocytes, and long arrowheads identify bronchiolar epithelial cells that stained positively with the anti-mouse GV sPLA2 antiserum after E. coli inoculation. Results are representative of n ≥ 8 independent experiments for each group.
FIGURE 3.
FIGURE 3.
Respiratory acidosis, hypothermia, and systemic inflammation in GV−/− mice after intra-tracheal E. coli injection. Shown is pH (A), pCO2 (mm Hg) (B), and pO2 (mmHg) (C) of arterial blood 18 h after injection of 109 cfu of E. coli into the trachea of GV+/+ (open bars) and GV−/− (filled bars) mice. D, shown is body temperature of GV+/+ (open triangle) and GV−/− (filled triangle) mice after intra-tracheal injection of NaCl and of GV+/+ (open oval) and GV−/− (filled rectangle) mice after intra-tracheal injection of 109 cfu E. coli. Shown are IL-6 (E), IL-10 (F), TNF-α (G), and MCP-1 (H) levels in arterial blood, pg/ml, at base line and 18 h after intra-tracheal injection of NaCl or 109 cfu of E. coli into GV+/+ (open bars) and GV−/− (filled bars) mice. a, p < 0.05, E. coli versus sham operation or base line; b, p < 0.05, GV+/+ versus GV−/−, ANOVA followed by paired t test, 2-tailed, unequal variance, n ≥ 8 independent experiments for each group.
FIGURE 4.
FIGURE 4.
Decreased leukocyte accumulation in BAL fluid in GV−/− mice after lung infection with E. coli. Shown is cell count in BAL fluid of GV+/+ (open bars) and GV−/− (filled bars) mice (A), percent of BAL fluid cells that is PMN (open bars) or alveolar macrophages (AM; closed bars) (B), and cytospin of BAL fluid 3 h after intra-tracheal injection of 0.9% NaCl or 109 cfu of E. coli (C). Shown is cell count in BAL fluid of GV+/+ (open bars) and GV−/− (filled bars) mice (D), percent of BAL fluid cells that is PMN (open bars) or alveolar macrophages (closed bars) (E), and cytospin of BAL fluid 18 h after intra-tracheal injection of 0.9% NaCl or 109 cfu of E. coli (F). Shown is cell count in BAL fluid of GV+/+ (open bars) and GV−/− (filled bars) mice (G), percent of BAL fluid cells that is PMN (open bars) or alveolar macrophages (closed bars) (H), and cytospin of BAL fluid 48 h after intra-tracheal injection of 0.9% NaCl or 109 cfu of E. coli, n ≥ 20 per group (I). Shown is surface expression of activated CD11b and CD18 (J) and annexin V expression on the surface of cells in BAL fluid from GV+/+ and GV−/− mice harvested 18 h after E. coli infection (K). Open bars, GV+/+; filled bars. GV−/−. PI, propidium iodide. n ≥ 6 per group. a, p < 0.05, E. coli versus NaCl; b, p < 0.05, GV+/+ versus GV−/−, ANOVA followed by paired t tests, 2 tailed, unequal variance, n ≥ 8 independent experiments for each group.
FIGURE 5.
FIGURE 5.
Lack of GV sPLA2 attenuates ICAM-1 and PECAM-1 expression in lung after E. coli infection. A, shown is an immunoblot analysis of selected adhesion molecules in lung tissue after intra-tracheal injection of 0.9% NaCl or 109 cfu of E. coli. Representative lung tissue samples from one GV+/+ and one GV−/− mouse after NaCl and from three GV+/+ and three GV−/− mice after E. coli infection are shown. Densitometric analysis of E-Selectin (B), ICAM-1 (C), and PECAM-1 (D) levels in lung tissue, normalized to actin levels, in GV+/+ (open bars) and GV−/− (filled bars) mice after NaCl or E. coli administration. a, p < 0.05, E. coli versus sham operation; b, p < 0.05, GV+/+ versus GV−/−, ANOVA followed by paired t test, 2-tailed, unequal variance, n = 8 per group. Immunohistochemical analysis with irrelevant primary isotype control antibody (E and F) or with specific rabbit primary antibodies against ICAM-1 (G and I) and PECAM-1 (H and J) in lungs 18 h after intra-tracheal injection of E. coli into GV+/+ or GV−/− mice (×400) is shown. Magnified views (×1200) for ICAM-1 and PECAM-1 are shown in panels I and J, respectively. Representative images from five independent experiments are shown.
FIGURE 6.
FIGURE 6.
Targeted deletion of GV sPLA2 does not alter eicosanoid levels in BAL fluid after E. coli infection. Eighteen hours after injection of 0.9% NaCl (sham operation) or 109 cfu of E. coli into the trachea of GV+/+ (open bars) or GV−/− (filled bars) mice, eicosanoid levels in BAL fluid were analyzed by LC/MS/MS. PGD2 (A), PGE2 (B), (TxB2 (C), PGF (D), 15-keto PGE2 (E), 15-keto PGF (F), 13,14-dh-15-keto PGE2 (G), 13,14-dh-15-keto PGA2 (H), LTB4 (I), 5-HETE (J), 11-HETE (K), and 12-HETE levels (L), expressed as ng/ml BAL fluid. a, p < 0.05, E. coli versus sham operation; ANOVA followed by paired t tests, 2-tailed, unequal variance, n = 8 − 10 independent experiments for each group.
FIGURE 7.
FIGURE 7.
Targeted deletion of GV sPLA2 modulates the levels of selected eicosanoids in lung after E. coli infection. Eighteen hours after injection of 0.9% NaCl (sham operation) or 109 cfu of E. coli into the trachea of GV+/+ (open bars) or GV−/− (filled bars) mice, eicosanoid levels in lung tissue (after BAL fluid harvest) were analyzed by LC/MS/MS. PGD2 (A), PGE2 (B), TxB2 (C), PGF (D), 15-keto PGE2 (E), 15-keto PGF (F), 13,14-dh-15-keto PGE2 (G), 13,14-dh-15-keto PGA2 (H), LTB4 (I), 5-HETE (J), 11-HETE (K), and 12-HETE levels (L), expressed as pg/mg of lung tissue. a, p < 0.05, E. coli versus sham operation or base line; b, p < 0.05, GV+/+ versus GV−/−, ANOVA followed by paired t tests, 2-tailed, unequal variance, n = 6 − 8 independent experiments for each group.
FIGURE 8.
FIGURE 8.
Lack of GV sPLA2 in non-myeloid cells attenuates alveolar leukocyte accumulation and lung E. coli clearance. After irradiation, female GV+/+ and GV−/− recipient mice were transplanted with bone marrow from male GV+/+ (open bars) or GV−/− (filled bars) donor mice. The status of the recipient mice, GV+/+ or GV−/−, is indicated on the x axis of all panels in this figure. Shown is the percent of cells in bone marrow (A) and the percent of alveolar macrophages in GV+/+ and GV−/− chimeras from donor bone marrow (B). Shown are cell counts (C), percentage of cells in BAL fluid that are PMN (D), bacterial viability (colony forming units) in BAL fluid (E), and lung after BAL fluid harvest (F) 18 h after intra-tracheal injection of 109 cfu of E. coli. a, p < 0.05, GV+/+ mice with GV+/+ bone marrow (n = 7) versus GV−/− mice with GV+/+ bone marrow (n = 10) or GV+/+ mice with GV−/− bone marrow (n = 7) versus GV−/− mice with GV−/− bone marrow (n = 10). b, p < 0.05, GV+/+ mice with GV+/+ bone marrow versus GV+/+ mice with GV−/− bone marrow or GV−/− mice with GV+/+ bone marrow versus GV−/− mice with GV−/− bone marrow; ANOVA followed by paired t test, 2-tailed, unequal variance.

Similar articles

Cited by

References

    1. Kochanek K. D., Smith B. L. (2004) Natl. Vital Stat. Rep. 52, 1–47 - PubMed
    1. Niederman M. S., McCombs J. S., Unger A. N., Kumar A., Popovian R. (1998) Clin. Ther. 20, 820–837 - PubMed
    1. Zhang P., Summer W. R., Bagby G. J., Nelson S. (2000) Immunol. Rev. 173, 39–51 - PubMed
    1. Greenberg S., Grinstein S. (2002) Curr. Opin. Immunol. 14, 136–145 - PubMed
    1. Lambeau G., Gelb M. H. (2008) Annu. Rev. Biochem. 77, 495–520 - PubMed

Publication types

MeSH terms

Substances