Comparative Study
. 2011 Aug 17;31(33):11795-807.
doi: 10.1523/JNEUROSCI.0905-11.2011.

Aminopyridines correct early dysfunction and delay neurodegeneration in a mouse model of spinocerebellar ataxia type 1

Affiliations
Comparative Study

Aminopyridines correct early dysfunction and delay neurodegeneration in a mouse model of spinocerebellar ataxia type 1

Raphael Hourez et al. J Neurosci. .

Abstract

The contribution of neuronal dysfunction to neurodegeneration is studied in a mouse model of spinocerebellar ataxia type 1 (SCA1) displaying impaired motor performance ahead of loss or atrophy of cerebellar Purkinje cells. Presymptomatic SCA1 mice show a reduction in the firing rate of Purkinje cells (both in vivo and in slices) associated with a reduction in the efficiency of the main glutamatergic synapse onto Purkinje cells and with increased A-type potassium current. The A-type potassium channel Kv4.3 appears to be internalized in response to glutamatergic stimulation in Purkinje cells and accumulates in presymptomatic SCA1 mice. SCA1 mice are treated with aminopyridines, acting as potassium channel blockers to test whether the treatment could improve neuronal dysfunction, motor behavior, and neurodegeneration. In acutely treated young SCA1 mice, aminopyridines normalize the firing rate of Purkinje cells and the motor behavior of the animals. In chronically treated old SCA1 mice, 3,4-diaminopyridine improves the firing rate of Purkinje cells, the motor behavior of the animals, and partially protects against cell atrophy. Chronic treatment with 3,4-diaminopyridine is associated with increased cerebellar levels of BDNF, suggesting that partial protection against atrophy of Purkinje cells is possibly provided by an increased production of growth factors secondary to the reincrease in electrical activity. Our data suggest that aminopyridines might have symptomatic and/or neuroprotective beneficial effects in SCA1, that reduction in the firing rate of Purkinje cells can cause cerebellar ataxia, and that treatment of early neuronal dysfunction is relevant in neurodegenerative disorders such as SCA1.


Figures

Figure 1.
Figure 1.
Time courses of motor behavior, morphological alterations, and cell death in SCA1 mice. Motor coordination was assessed by the latency to fall from an accelerated rotarod; morphology was assessed by calbindin labeling in green (toto red counterstaining). Scale bar, 60 μm. Three-week-old SCA1 mice have normal motor coordination (a) and normal morphology (b). Five-week-old SCA1 mice display impaired motor performance (c), but no morphological alteration (d). Ten-week-old SCA1 mice display impaired motor performance (e) and morphological alterations (f). Eighteen-week-old SCA1 mice display impaired motor performance (g) and morphological alterations (h). Rotarods: two-way ANOVA followed by Fisher's test, 3 weeks, 13 WT and 16 SCA1, p = 0.92; 5 weeks, 14 WT and 14 SCA1, p = 0.043; 10 weeks, 14 WT and 14 SCA1, p = 1.2 × 10⁻⁵; 18 weeks, 20 WT and 19 SCA1, p = 5.2 × 10⁻⁵. *p < 0.05; ***p < 0.001. Error bars indicate SEM in all figures.
Figure 2.
Figure 2.
The firing frequency of PCs is reduced in presymptomatic SCA1 mice. a, Firing pattern of PCs in brain slices from control mice (WT), mice heterozygous for human mutated ataxin1 [SCA heterozygous (82Q)], homozygous for human mutated ataxin1 [SCA homozygous (82Q)], and heterozygous for normal human ataxin1 [A02 heterozygous (30Q)]. b, In vivo firing pattern of PCs from WT and SCA1 mice (heterozygous for human mutated ataxin1). c, Firing frequency of PCs in brain slices from WT mice (n = 18PCs), mice heterozygous for human mutated ataxin1 (n = 35), homozygous for human mutated ataxin1 (n = 28), and heterozygous for normal human ataxin1 (n = 24) (one-way ANOVA followed by Fisher's test, WT vs SCAhet, p = 0.025; WT vs SCAhom, p = 0.00001; WT vs A02, p = 0.55; SCAhet vs SCAhom, p = 0.034; *p < 0.05; **p < 0.01; ***p < 0.001) (color code as in a). d, In vivo simple spikes frequency from WT (n = 35) and SCA1 (n = 35) PCs (t test, p = 0.00027). e, Delayed acquisition of eyeblink conditioning in presymptomatic SCA1 mice. Eyeblink conditioning is assessed by the percentage of conditioned response (eyeblink after a sound alone) after days of conditioning sessions associating a sound (conditioned stimulus) to an air puff directed to the eye and causing an eyeblink (unconditioned stimulus) [WT mice (n = 5) vs SCA1 (n = 7); one-way ANOVA followed by Fisher's test, p = 0.00032]. Error bars indicate SEM. f, g, The morphology of the Purkinje cell is not altered in presymptomatic SCA1 mice. f, Typical appearance of biocytin-loaded Purkinje cells from 3-week-old wild-type (left) and SCA1 (right) mice. Scale bar, 50 μm. g, Typical appearance of biocytin-loaded dendrites from Purkinje cells from 3-week-old wild-type (left) and SCA1 (right) mice. Scale bar, 8 μm.
Figure 3.
Figure 3.
Decreased synaptic strength of the parallel fiber–PC synapse in presymptomatic SCA1 mice. a, Typical input–output relationships obtained from PCs in response to an increasing stimulation of parallel fibers in a control (top panel) and a SCA1 (bottom panel) PC. Negative current pulses ranging from 0 to 11 μA were delivered in ascending order. b, Linear relationship between evoked EPSC initial slope and stimulus intensity in the cells illustrated in a. c, Typical traces of paired-pulse facilitation, a short-term synaptic plasticity reflecting the probability of glutamate release from the presynaptic parallel fibers after a second stimulation that closely follows a first one, in control and SCA1 mice. d, The paired-pulse facilitation ratio was expressed as the maximal amplitude of the second EPSC divided by the maximal amplitude of the first EPSC (WT, n = 10; SCA, n = 12; one-way ANOVA followed by Fisher's test, p = 0.9). This result suggests that the presynaptic side of the parallel fiber–Purkinje cell synapse is not altered. Error bars indicate SEM. e, Representative mEPSCs from three different WT and SCA PCs. f, Cumulative mean amplitude distributions of mEPSCs in PCs from WT (n = 6) and SCA1 (n = 7) mice showing a significant shift (Kolmogorov–Smirnov test, ***p < 0.001) toward smaller amplitudes in SCA1 mice. g, mEPSC frequency is not different in PCs from WT and SCA1 mice. h, i, mEPSCs from SCA1 mice show slower kinetics (longer time to rise and time to decay) compared with WT mice (Kolmogorov–Smirnov test, ***p < 0.001).
Figure 4.
Figure 4.
Increased IKA in PCs from presymptomatic SCA1 mice. a, Typical PC excitability recordings (50, 100, 150 pA current injections from a holding potential of −80 mV) from a wild-type (left panel) and a SCA1 (right panel) mouse. A significant proportion of SCA1 cells displayed an irregular plateau potential delaying the first action potential. The asterisk (*) indicates the irregular plateau potential in a and b. b, The irregular plateau potential is reversibly abolished by 50 μm 4-aminopyridine (left panel) and can be elicited by a hyperpolarizing prepulse (right panel). c, Typical current trace of IKA evoked in a PC from a WT or SCA1 mouse by a 60 mV depolarization from a −80 mV holding potential after subtraction of sustained inactivating K+ currents. d, Typical IKA current traces from a SCA1 PC before and after successive application of hongotoxin, stromatoxin, and phrixotoxin.
Figure 5.
Figure 5.
Kv4 channels are not overexpressed in presymptomatic SCA1 mice. a, d, g, Immunohistochemistry using antibody directed against Kv4.1 (a), Kv4.2 (d), or Kv4.3 (g) in 5-week-old WT and SCA1 mice. Scale bar, 250 μm. b, e, h, In situ hybridization using probes directed against Kv4.1 (b), Kv4.2 (e), or Kv4.3 (h) in 5-week-old WT and SCA1 mice. Scale bar, 1 mm. c, f, i, Western blotting of whole cerebellum using antibody directed against Kv4.1 (c), Kv4.2 (f), or Kv4.3 (i) in 5-week-old WT and SCA1 mice. Actin was used to normalize protein loading (bottom band).
Figure 6.
Figure 6.
Altered glutamatergic transmission is associated with the increased IKA and more abundant surface Kv4.3 channels in PCs from presymptomatic SCA1 mice. a, Typical IKA current trace before and after application of glutamate (50 μm) on a PC from a WT or SCA1 mouse. b, Normalized IKA amplitudes showing that glutamate significantly reduces peak IKA (5 cells/group, paired t test, WT pre vs post p = 0.009; SCA pre vs post, p = 0.0006) and suppresses the difference in IKA between WT and SCA1 PCs (t test, WT vs SCA before glutamate, p = 0.036; WT vs SCA after glutamate, p = 0.4). c, Typical IKA current trace before and after application of AMPA (50 μm) on a PC from a WT or SCA1 mouse. d, Normalized IKA amplitudes showing that AMPA significantly reduces peak IKA (5 cells/group, paired t test, WT pre vs post p = 0.002; SCA pre vs post, p = 0.001) and suppresses the difference in IKA between WT and SCA1 PCs (t test, WT vs SCA before AMPA, p = 0.04; WT vs SCA after AMPA, p = 0.9). e, Typical IKA current trace before and after application of NMDA (20 μm) on a PC from a WT or SCA1 mouse. f, Normalized IKA amplitudes showing that NMDA has no effect on peak IKA (5 cells/group, paired t test, WT pre vs post, p = 0.4; SCA pre vs post, p = 0.3; WT pre vs SCA pre, p = 0.04). g–i, Normalized amplitudes of sustained K+ current evoked by a depolarization to −20 mV from a holding potential of −40 mV showing the absence of effect of glutamate, AMPA, and NMDA and the absence of difference between WT and SCA1 PCs [5 cells/group, experiments with glutamate (g), WT pre vs post, p = 0.33 (paired t test), SCA pre vs post, p = 0.73, WT vs SCA, p = 0.42 (t test); experiments with AMPA (h), WT pre vs post, p = 0.52, SCA pre vs post, p = 0.51, WT vs SCA, p = 0.91; experiments with NMDA (i), WT pre vs post, p = 0.47, SCA pre vs post, p = 0.31, WT vs SCA, p = 0.22]. Error bars indicate SEM. j, Total and surface levels of Kv4.3 channels were determined in the anterior vermis by Western blotting and biotinylation assay. Endogenous Rab4 is shown as cytoplasmic control; actin is shown as loading control. *p < 0.05; **p < 0.01; ***p < 0.001.
Figure 7.
Figure 7.
IKA blockers normalize PCs firing frequency in SCA1 mice, normalize the motor phenotype of early symptomatic SCA1 mice, and improve the motor phenotype of old SCA1 mice only if administered chronically. a, DiAP normalizes the latency to fall from an accelerated rotarod of 5-week-old SCA1 mice but has no significant effect on 5-week-old control mice (WT NaCl, n = 24; WT DiAP, n = 23; SCA NaCl, n = 24; SCA DiAP, n = 23; WTNaCl vs WTDiAP, p = 0.68; WTNaCl vs SCANaCl, p = 0.0035; WTNaCl vs SCADiAP, p = 0.11; SCANaCl vs SCADiAP, p = 0.04). b, Typical firing pattern of PCs in brain slices from 5-week-old control or SCA1 mice after injection of NaCl or DiAP. c, Firing frequency of PCs from 5-week-old wild-type or SCA1 mice subcutaneously injected with DiAP or saline (WT NaCl, n = 12; WT DiAP, n = 10; SCA NaCl, n = 11; SCA DiAP, n = 8; WT NaCl vs WT DiAP, p = 0.09; WT NaCl vs SCA NaCl, p = 0.0002; WT NaCl vs SCA DiAP, p = 0.14; SCA NaCl vs SCA DiAP, p = 0.03). d, AP normalizes the latency to fall from an accelerated rotarod of 5-week-old SCA1 mice but has no significant effect on 5-week-old control mice (WT NaCl, n = 24; WT AP, n = 23; SCA NaCl, n = 24; SCA DiAP, n = 24; two-way ANOVA followed by Fisher's test, WT NaCl vs WT AP, p = 0.14; WT NaCl vs SCA NaCl, p = 0.0035; WT NaCl vs SCA AP, p = 0.16; SCA NaCl vs SCA AP, p = 0.04). e, Continuous chronic treatment with DiAP using subcutaneous osmotic pumps improves motor performance of 5-week-old SCA1 mice [WT NaCl (n = 20), SCA NaCl (n = 19), SCA DiAP (n = 19), two-way ANOVA followed by Fisher's test, WT NaCl vs SCA NaCl, p = 2 × 10⁻⁵; WT NaCl vs SCA DiAP, p = 0.018; SCA NaCl vs SCA DiAP, p = 0.035]. f, Acute treatment with DiAP has no effect on the latency to fall from an accelerated rotarod of 18-week-old SCA1 mice (WT NaCl, n = 13; WT DiAP, n = 11; SCA NaCl, n = 20; SCA DiAP, n = 20; WT NaCl vs WT DiAP, p = 0.11; WT NaCl vs SCA NaCl, p = 0.00004; WT NaCl vs SCA DiAP, p = 7 × 10⁻⁷; SCA NaCl vs SCA DiAP, p = 0.21). g, Acute treatment with DiAP has no effect on the grip strength of 18-week-old SCA1 mice (one-way ANOVA followed by Fisher's test, WT NaCl vs WT DiAP, p = 0.43; WT NaCl vs SCA NaCl, p = 1 × 10⁻¹⁰; WT NaCl vs SCA DiAP, p = 2 × 10⁻⁹; SCA NaCl vs SCA DiAP, p = 0.49). h, Acute treatment with DiAP has no effect on the latency to fall from a stationary thin rod of 18-week-old SCA1 mice (one-way ANOVA followed by Fisher's test, WT NaCl vs WT DiAP, p = 0.3; WT NaCl vs SCA NaCl, p = 3 × 10⁻⁵; WT NaCl vs SCA DiAP, p = 3 × 10⁻⁶; SCA NaCl vs SCA DiAP, p = 0.07). i, Firing frequency of PCs from 18-week-old wild-type or SCA1 mice acutely treated with DiAP or saline (WT NaCl, n = 9; WT DiAP, n = 10; SCA NaCl, n = 10; SCA DiAP, n = 15; WTNaCl vs WTDiAP, p = 0.02; WTNaCl vs SCANaCl, p = 0.0003; WTNaCl vs SCADiAP, p = 0.19; SCANaCl vs SCADiAP, p = 0.004). j, Typical firing pattern of Purkinje cells in cerebellar slice from 18-week-old WT and SCA1 mice after acute treatment with saline or DiAP. k, Chronic treatment with DiAP increased the latency to fall from an accelerated rotarod of 18-week-old SCA1 mice (WT NaCl, n = 20; WT DiAP, n = 12; SCA NaCl, n = 18; SCA DiAP, n = 19; WT NaCl vs WT DiAP, p = 0.68; WT NaCl vs SCA NaCl, p = 3 × 10⁻⁶; WT NaCl vs SCA DiAP, p = 0.004; SCA NaCl vs SCA DiAP, p = 0.04). l, Chronic treatment with DiAP increased the grip strength of 18-week-old SCA1 mice (WT NaCl vs WT DiAP, p = 0.85; WT NaCl vs SCA NaCl, p = 0.0001; WT NaCl vs SCA DiAP, p = 0.04; SCA NaCl vs SCA DiAP, p = 0.04). m, Chronic treatment with DiAP increased the latency to fall from a stationary thin rod of 18-week-old SCA1 mice (WT NaCl vs WT DiAP, p = 0.64; WT NaCl vs SCA NaCl, p = 3 × 10⁻⁵; WT NaCl vs SCA DiAP, p = 0.02; SCA NaCl vs SCA DiAP, p = 0.04). n, Firing frequency of PCs from 18-week-old wild-type or SCA1 mice chronically treated with DiAP or saline (WT NaCl, n = 11; WT DiAP, n = 8; SCA NaCl, n = 22; SCA DiAP, n = 19; WT NaCl vs WT DiAP, p = 0.11; WT NaCl vs SCA NaCl, p = 0.004; WT NaCl vs SCA DiAP, p = 0.25; SCA NaCl vs SCA DiAP, p = 0.03). Error bars indicate SEM. o, Typical firing pattern of Purkinje cells in cerebellar slice from 18-week-old WT and SCA1 mice after chronic treatment with saline or DiAP. *p < 0.05; **p < 0.01; ***p < 0.001.
Figure 8.
Figure 8.
Bath application of 4-aminopyridine has no effect on the amplitude and frequency of mEPSCs recorded in PCs from 4- to 5-week-old WT mice. a, Typical mEPSCs recording before and 5 min after bath application of 50 μm 4-aminopyridine. b, Cumulative mean amplitude distributions of mEPSCs in PCs (n = 6) from mice before and after application of 4-aminopyridine (Kolmogorov–Smirnov test, p > 0.05). c, Cumulative interevent time interval distributions of mEPSCs in PCs (n = 6) from mice before and after application of 4-aminopyridine (Kolmogorov–Smirnov test, p > 0.05).
Figure 9.
Figure 9.
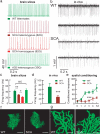
Chronic treatment with IKA blockers partially protects PCs from atrophy and increases cerebellar levels of BDNF in SCA1 mice. a, Typical appearance and quantification of the thickness of the molecular layer of 18-week-old WT or SCA1 mice chronically treated with NaCl or DiAP (WT NaCl, n = 6 mice; WT DiAP, n = 4; SCA NaCl, n = 5; SCA DiAP, n = 7; one-way ANOVA followed by Fisher's test, WT NaCl vs WT DiAP, p = 0.06; WT NaCl vs SCA NaCl, p = 9 × 10⁻⁸; WT NaCl vs SCA DiAP, p = 0.0015; SCA NaCl vs SCA DiAP, p = 2 × 10⁻⁶). b, Typical appearance and quantification of the volume of biocytin-loaded PCs from 18-week-old WT or SCA1 mice chronically treated with NaCl or DIAP (WT NaCl, n = 10 cells; WT DiAP, n = 13; SCA NaCl, n = 32; SCA DiAP, n = 18; one-way ANOVA followed by Fisher's test, WT NaCl vs WT DiAP, p = 0.07; WT NaCl vs SCA NaCl, p = 0.037; WT NaCl vs SCA DiAP, p = 0.58; SCA NaCl vs SCA DiAP, p = 0.04). c, Typical appearance of the dendritic tree of PCs from 18-week-old WT or SCA1 mice chronically treated with NaCl or DIAP and quantification of the density of dendritic spines (2 dendrites analyzed per cell; one-way ANOVA followed by Fisher's test, WT NaCl vs WT DiAP, p = 0.33; WT NaCl vs SCA NaCl, p = 2 × 10⁻⁵; WT NaCl vs SCA DiAP, p = 0.12; SCA NaCl vs SCA DiAP, p = 0.0006). d, Representative recordings obtained from PCs in response to an increasing stimulation of parallel fibers from 18-week-old WT or SCA1 mice chronically treated with NaCl or DiAP. e, Western blotting for BDNF and actin from cerebella of 18-week-old WT or SCA1 mice chronically treated with NaCl or DiAP and quantification of BDNF/actin ratio (WT NaCl, n = 8; WT DiAP, n = 4; SCA NaCl, n = 8; SCA DiAP, n = 8; one-way ANOVA followed by Fisher's test, WT NaCl vs WT DiAP, p = 0.7; WT NaCl vs SCA NaCl, p = 0.029; WT NaCl vs SCA DiAP, p = 0.67; SCA NaCl vs SCA DiAP, p = 0.011). f, Normalized Purkinje cell count (11 WT NaCl, 4 WT DiAP, 9 SCA NaCl, 13 SCA DiAP; one-way ANOVA followed by Fisher's test, WT NaCl vs WT DiAP, p = 0.19; WT NaCl vs SCA NaCl, p = 0.003; WT NaCl vs SCA DiAP, p = 0.0001; SCA NaCl vs SCA DiAP, p = 0.54). g, Representative Western blot of ataxin-1 (top) and a loading control (GAPDH) in cerebella from saline-treated WT mice (first lane), saline-treated SCA1 mice (second lane), and DiAP-treated SCA1 mice (last lane). h, Normalized ataxin-1/GAPDH ratio (n = 4/group; 100% = saline-treated SCA1 mice, SCA NaCl vs SCA DiAP, p = 0.82) showed no change in expanded ataxin-1 expression by chronic treatment with 3.4 diaminopyridine. Error bars indicate SEM. *p < 0.05; **p < 0.01; ***p < 0.001.

References

    1. Adcock KH, Metzger F, Kapfhammer JP. Purkinje cell dendritic tree development in the absence of excitatory neurotransmission and of brain-derived neurotrophic factor in organotypic slice cultures. Neuroscience. 2004;127:137–145. - PubMed
    1. Alviña K, Khodakhah K. The therapeutic mode of action of 4-aminopyridine in cerebellar ataxia. J Neurosci. 2010;30:7258–7268. - PMC - PubMed
    1. Balkowiec A, Katz DM. Cellular mechanisms regulating activity-dependent release of native brain-derived neurotrophic factor from hippocampal neurons. J Neurosci. 2002;22:10399–10407. - PMC - PubMed
    1. Beazely MA, Lim A, Li H, Trepanier C, Chen X, Sidhu B, Macdonald JF. Platelet-derived growth factor selectively inhibits NR2B-containing N-methyl-d-aspartate receptors in CA1 hippocampal neurons. J Biol Chem. 2009;284:8054–8063. - PMC - PubMed
    1. Burright EN, Clark HB, Servadio A, Matilla T, Feddersen RM, Yunis WS, Duvick LA, Zoghbi HY, Orr HT. SCA1 transgenic mice: a model for neurodegeneration caused by an expanded CAG trinucleotide repeat. Cell. 1995;82:937–948. - PubMed

Publication types

MeSH terms

LinkOut - more resources