Comparative Study
. 2011 Aug 17;31(33):11855-66.
doi: 10.1523/JNEUROSCI.2525-11.2011.

The postnatal accumulation of junctional E-cadherin is inversely correlated with the capacity for supporting cells to convert directly into sensory hair cells in mammalian balance organs

Affiliations
Comparative Study

The postnatal accumulation of junctional E-cadherin is inversely correlated with the capacity for supporting cells to convert directly into sensory hair cells in mammalian balance organs

Maria Sol Collado et al. J Neurosci. .

Abstract

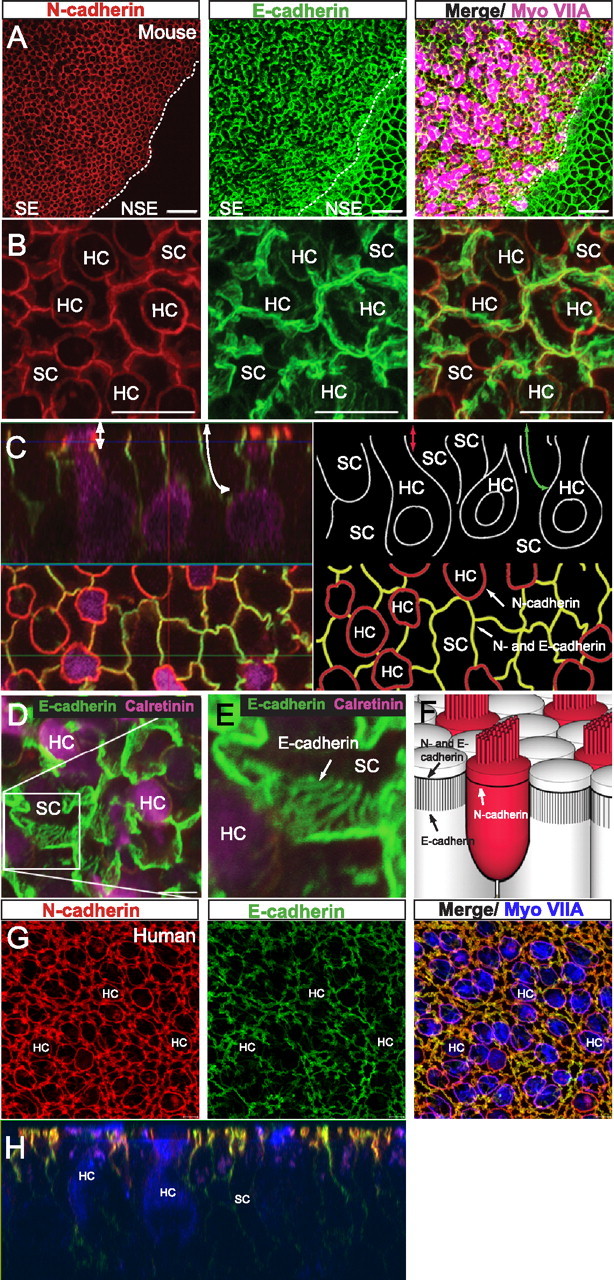
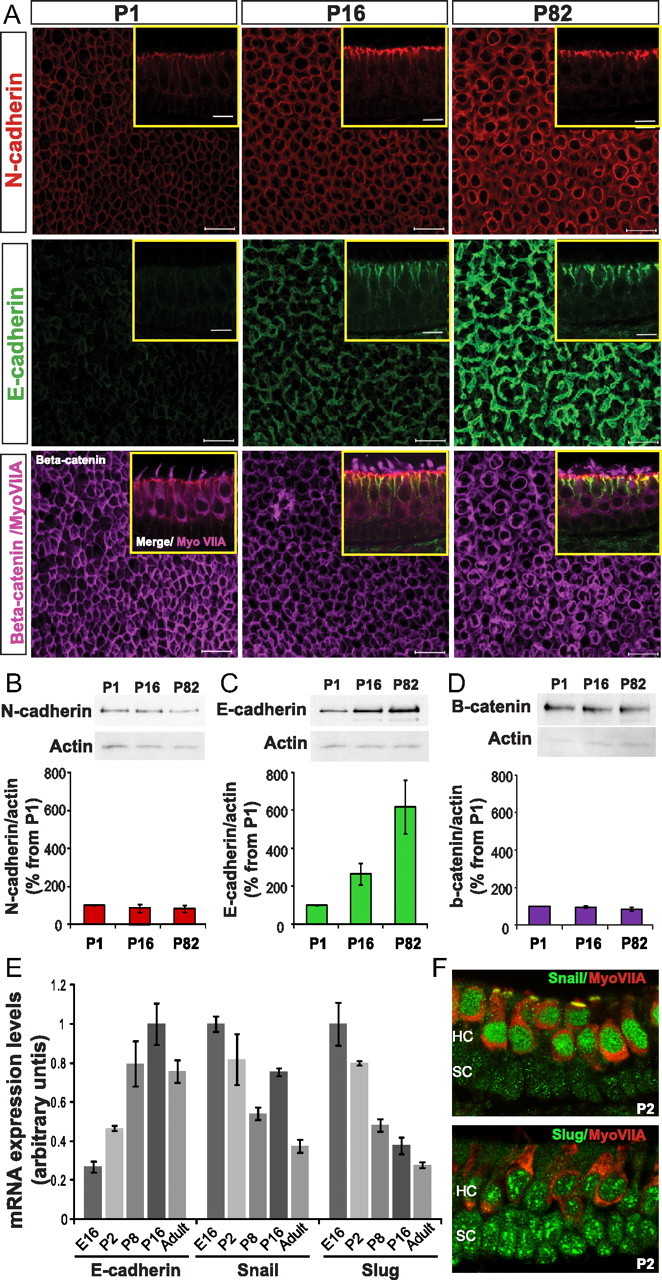
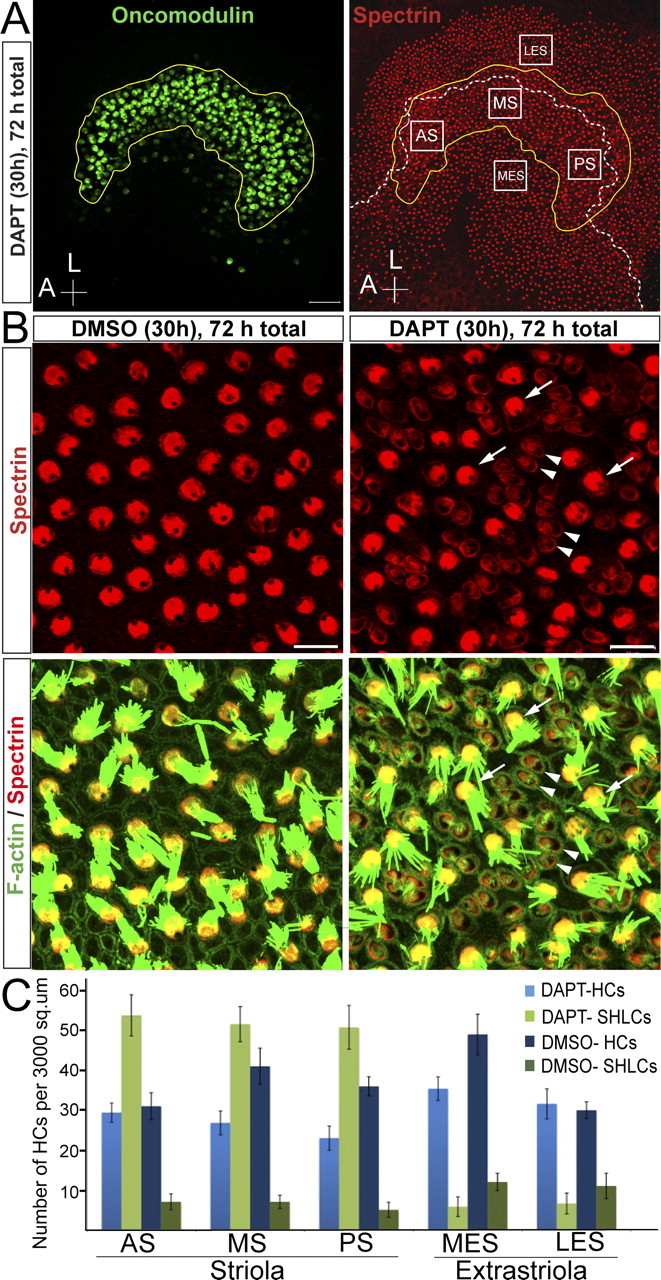
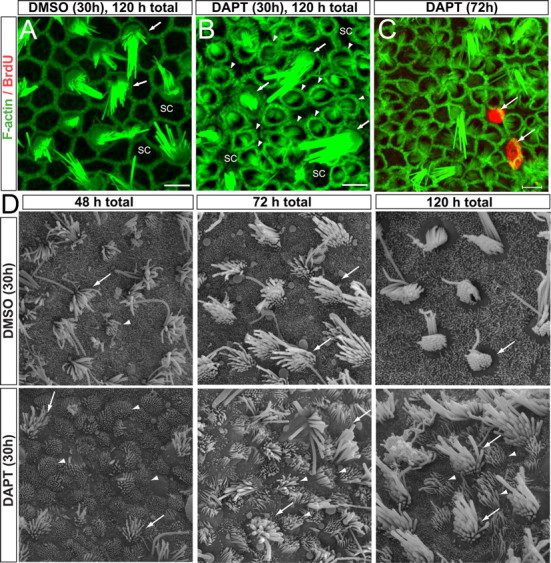
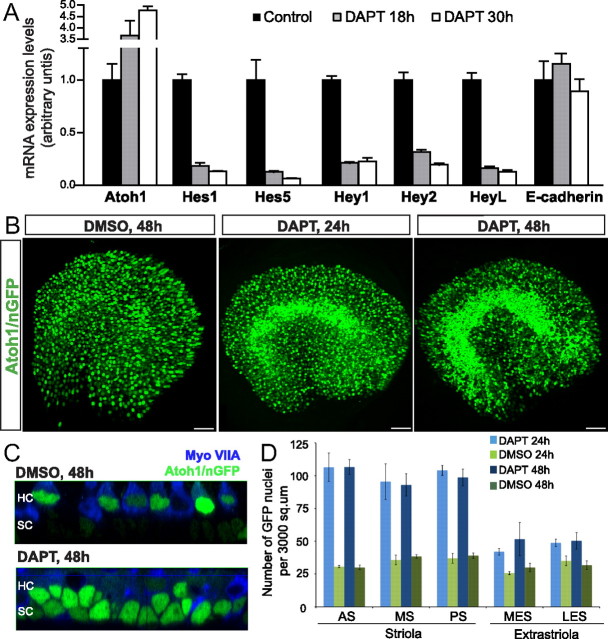
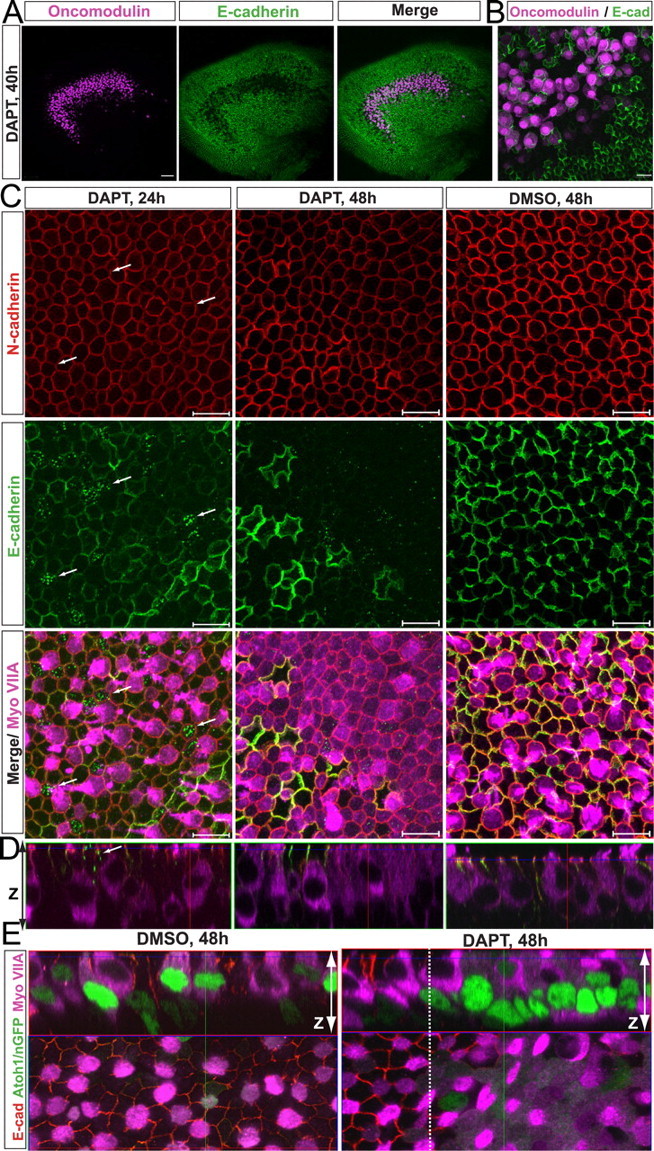
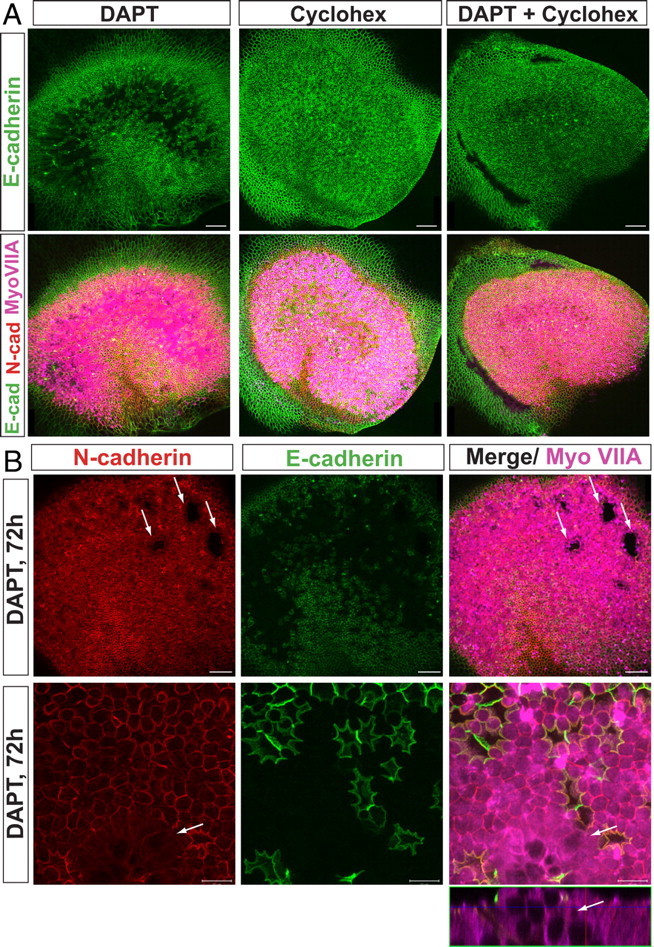
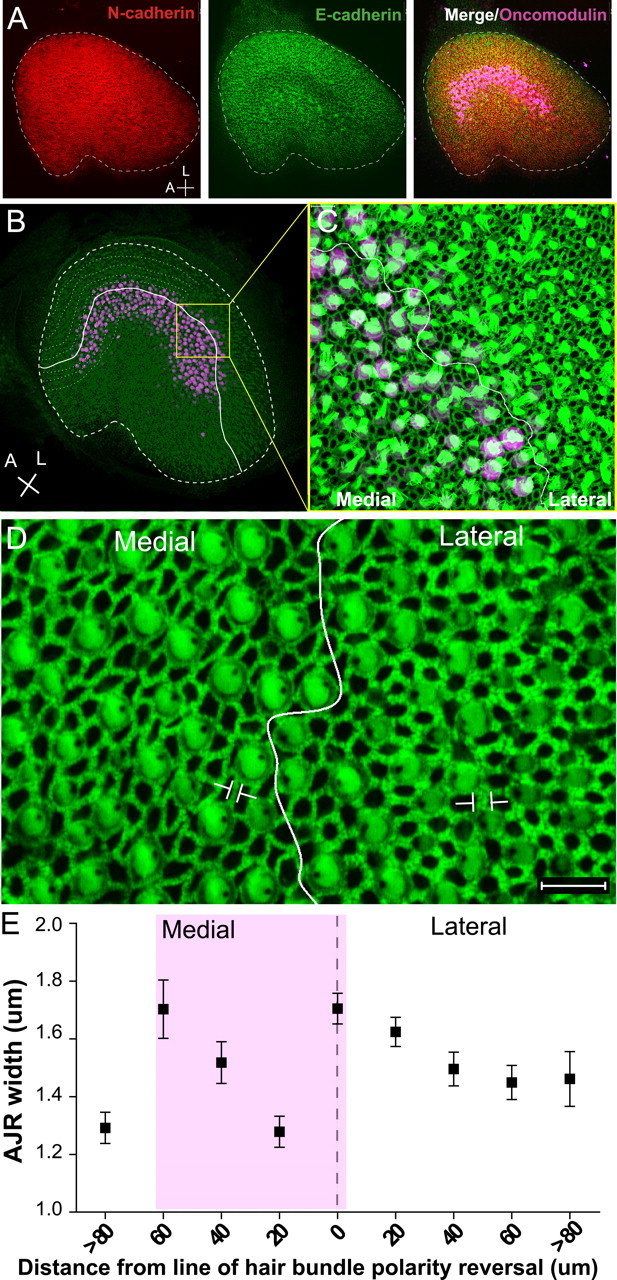
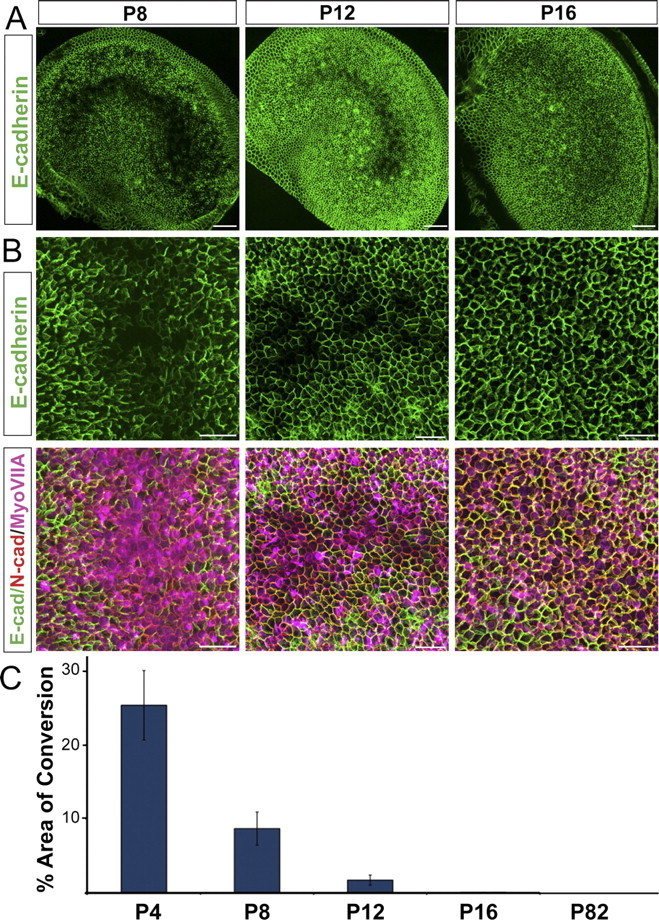
Mammals experience permanent impairments from hair cell (HC) losses, but birds and other non-mammals quickly recover hearing and balance senses after supporting cells (SCs) give rise to replacement HCs. Avian HC epithelia express little or no E-cadherin, and differences in the thickness of F-actin belts at SC junctions strongly correlate with different species' capacities for HC replacement, so we investigated junctional cadherins in human and murine ears. We found strong E-cadherin expression at SC-SC junctions that increases more than sixfold postnatally in mice. When we cultured utricles from young mice with γ-secretase inhibitors (GSIs), striolar SCs completely internalized their E-cadherin, without affecting N-cadherin. Hes and Hey expression also decreased and the SCs began to express Atoh1. After 48 h, those SCs expressed myosins VI and VIIA, and by 72 h, they developed hair bundles. However, some scattered striolar SCs retained E-cadherin and the SC phenotype. In extrastriolar regions, the vast majority of SCs also retained E-cadherin and failed to convert into HCs even after long GSI treatments. Microscopic measurements revealed that the junctions between extrastriolar SCs were more developed than those between striolar SCs. In GSI-treated utricles as old as P12, differentiated striolar SCs converted into HCs, but such responses declined with age and ceased by P16. Thus, temporal and spatial differences in postnatal SC-to-HC phenotype conversion capacity are linked to the structural attributes of E-cadherin containing SC junctions in mammals, which differ substantially from their counterparts in non-mammalian vertebrates that readily recover from hearing and balance deficits through hair cell regeneration.


Figures

Figure 1.
Figure 1.
Cadherin localization in the mature mammalian utricle. A, Immunolabeling of a whole-mount utricle from an adult mouse for N-cadherin (red), E-cadherin (green), and myosin VIIA (Myo VIIA, purple). Image shows part of sensory epithelium (SE, left) and nonsensory epithelium (NSE, bottom right). Dashed line delineates the border between SE and NSE. B, Maximal projection image of the apical surface of an adult utricular sensory epithelium immunostained for N-cadherin (red) and E-cadherin (green). C, Left, Section along the z-axis (top) and x–y-axis (bottom) of an adult mouse utricle immunostained for N-cadherin (red), E-cadherin (green), and calretinin (purple). Right, Schematic diagram of the image on the left. The long green arrow indicates the length of E-cadherin in the z-axis, and the short red arrow indicates the length of N-cadherin. D, E, Maximal projection image of adult mouse utricle immunostained for E-cadherin and calretinin. E is an inset of D showing the detailed lines of E-cadherin expression that descend along the basolateral membranes of SCs. F, 3D schematic of N- and E-cadherin localization in the utricular sensory epithelium. G, Maximal projection image showing the serpentine pattern of cadherins in an adult human utricular sensory epithelium. H, Section along the z-axis of utricle in G. Scale bars: A, 20 μm; B, 10 μm; D, 5 μm.
Figure 2.
Figure 2.
Levels of E-cadherin at the SC–SC junctions increase as mice mature postnatally. A, Representative images of sensory epithelium in whole-mount utricles from P1, P16, and P82 mice immunolabeled for N-cadherin (red), E-cadherin (green), and β-catenin (purple). Insets, Representative images of cryostat sections of utricles from P1, P16, and P82 mice immunolabeled for N-cadherin (red), E-cadherin (green), and myosin VIIA (purple). Scale bars, 10 μm. B–D, A representative example of a Western blot showing levels of N-cadherin (B), E-cadherin (C), β-catenin (D), and total actin (internal control) in pure delaminated utricular sensory epithelia harvested from P1, P16, and P82 mice. Bottom, Summary of quantification of experiments. Levels of N-cadherin, E-cadherin, and β-catenin were normalized to total actin levels, and values were expressed as a percentage relative to P1 for comparison. Average percentages relative to P1 are shown (n = 5). E, Relative mRNA expression levels of E-cadherin, Snail, and Slug in E16, P2, P8, P16, and adult utricles (n = 3 for each age). mRNA levels for each gene were made relative to the highest for comparison. F, Images of cryostat sections of utricles from P2 mice immunolabeled for myosin VIIA (red), snail (green, top), or slug (green, bottom).
Figure 3.
Figure 3.
The γ-secretase inhibitor DAPT induces a rapid and robust phenotypic conversion of striolar supporting cells into hair cells in neonatal utricles. A, Maximal projection image of a DAPT-treated utricle labeled for oncomodulin (green) and spectrin (red). The striolar region (yellow line) was delineated using oncomodulin as a marker. The line of polarity reversal (white dashed line) was drawn using spectrin labeling of cuticular plates. The image also illustrates the size of the 3000 μm2 areas that were quantified by counting preexisting HCs and SHLCs (anterior striola, AS; middle striola, MS; posterior striola, PS; medial extrastriola, MES; lateral extrastriola, LES). B, Higher-magnification image of a DMSO-treated and a DAPT-treated utricle labeled for spectrin (red) and F-actin (green) at the level of the striola. Arrowheads point to the newly generated hair-cell-like cells and arrows point to mature, preexisting hair cells. Scale bars: A, 50 μm; B, 10 μm. C, Quantification of the number of preexisting HCs and SHLCs per 3000 μm2 in utricles treated with DAPT or vehicle for the first 30 h and cultured for a total of 72 h.
Figure 4.
Figure 4.
DAPT induces the elongation of microvilli and the formation of hair-cell-like bundles on supporting cell surfaces in the striola of the neonatal utricle. A, B, F-actin labeled sensory epithelia from utricles treated with vehicle (DMSO, 0.2%; left, A) and DAPT (B) for the first 30 h and cultured for a total 120 h. Images were taken at the level of the striola. Arrowheads point to newly generated hair-cell-like cells, and arrows point to mature, preexisting hair cells. Scale bars, 5 μm. C, Image of the striola region of a DAPT-treated utricle immunolabeled for BrdU (red) and F-actin (green). Arrows point to BrdU-positive SCs. D, Scanning electron micrographs of DAPT- or vehicle-treated utricles cultured for a total of 48, 72, and 120 h. Arrowheads point to newly generated hair-cell-like cells, and arrows point to mature, preexisting hair cells.
Figure 5.
Figure 5.
DAPT induces downregulation of Hes and Hey genes and Atoh1 expression in striolar SCs. A, Relative mRNA expression levels for Atoh1, Hes1, Hes5, Hey1, Hey2, HeyL, and E-cadherin in P2 utricles treated with DAPT or vehicle (DMSO) for 18 and 30 h (n = 3 for each gene). mRNA levels for each gene were plotted relative to their respective vehicle control mRNA levels. B, Atoh1 expression in whole-mount P2 Atoh1/nGFP utricles treated with vehicle for 48 h (left) or DAPT for 24 h (middle) or 48 h (right). Scale bars, 50 μm. C, Images showing z-axis of Atoh1/nGFP fluorescence in P2 utricles treated with DMSO or DAPT and immunostained for myosin VIIA (blue). Images taken at the level of striola. D, Quantification of GFP-positive cells in five 3000 μm2 regions (anterior striola, AS; middle striola, MS; posterior striola, PS; medial extrastriola, MES; lateral extrastriola, LES) of P2 utricles treated with DAPT or DMSO for two durations.
Figure 6.
Figure 6.
DAPT induces downregulation of E-cadherin and subsequent upregulation of myosin VIIA in striolar SCs. A, Image of a utricle treated with DAPT for 40 h and immunostained for oncomodulin (purple) and E-cadherin (green). Depletion of E-cadherin occurs specifically in the striolar region, which shows immunostaining for the type I hair cell marker oncomodulin. Scale bar, 50 μm. B, Higher-magnification image of the striolar region. Scale bar, 10 μm. C, Higher-magnification images of the striolar sensory epithelium. Arrows point to cells that show E-cadherin internalization. Myosin VIIA is upregulated after 48 h of DAPT treatment in cells of the striola. Scale bars, 10 μm. D, Images showing z-axis of sensory epithelium of utricles treated with vehicle or DAPT for 24 or 48 h. Arrow points to cells that show E-cadherin internalization. E, Images showing x–y-axis and z-axis of Atoh1/nGFP P2 utricles treated with vehicle (DMSO) or DAPT and immunostained for E-cadherin (red) and myosin VIIA (purple). The image of the DMSO control utricle was taken at the striolar/peristriolar boundary. In the image of the DAPT-treated utricle, the extrastriolar region is to the left of the white dashed line, and the striolar region is to the right.
Figure 7.
Figure 7.
DAPT treatments progressively induce E-cadherin depletion and SC-to-HC conversion in a protein synthesis-dependent manner. A, Whole-mount utricles treated with DAPT (50 μm), DAPT and cycloheximide (40 μm), or cycloheximide for 30 h and immunostained for N-cadherin (red), E-cadherin (green), and myosin VIIA (purple). B, Top, Images of whole-mount utricles showing conversion regions. Arrows point to “holes” in epithelium attributable to detachment of converted SCs from the basal lamina. Scale bars, 50 μm. Bottom, High-magnification images of the x–y-axis and z-axis taken at the level of the striola, showing regions of conversion in which converting SCs resemble HCs and lift up from the basal lamina. Scale bars, 10 μm. A, Anterior; L, lateral.
Figure 8.
Figure 8.
The width of circumferential F-actin bands in P2 mice utricles is thinnest in striolar supporting cells. A, Image of a P2 mouse whole-mount utricle cultured with the vehicle for 48 h and labeled for E-cadherin (green), N-cadherin (red), and striolar marker oncomodulin (purple). Scale bars, 50 μm. B, P2 mouse utricle labeled for F-actin (green) and oncomodulin (purple). The solid white line marks the line of hair bundle polarity reversal, and the thick dashed line marks the outer edge of the sensory epithelium. The thinner dashed lines illustrate transects followed in the quantification process, in which the widths of 100 AJRs along each side of the line of polarity reversal were measured in relation to the shortest distance from the measured cell to the line of reversal. C, Higher-magnification image of B. D, High-resolution image showing the difference in widths of F-actin bands in the regions lateral and medial to the line of polarity reversal (white line) at the level of the striola. E, Quantification of AJR widths plotted as a function of the shortest distance to the line of hair bundle polarity reversal. Data were binned in 20 μm intervals. Data point 0 and dashed line indicate the line of reversal. Purple shadowing represents the location of the striola.
Figure 9.
Figure 9.
The number of SCs that downregulate E-cadherin and convert into HCs after DAPT treatments declines with postnatal maturation, so that by P16 SCs no longer convert into HCs. Whole mount utricles harvested from P8, P12 and P16, treated with DAPT for 72 h and labeled for E-cadherin (green), N-cadherin (red) and myosin VIIA (purple). A, Images of whole utricles showing regions of E-cadherin depletion. Scale bars are 50 μm. Please note that E-cadherin levels are not comparable between the different age group images in this figure. Image intensity was individually optimized for each age. Although E-cadherin levels appear to be lower in the striolar regions at all ages, E-cadherin is completely absent only in the P8 and P12 shown. B, Higher magnification images taken at the level of the striola, showing that the regions of conversion become progressively smaller until disappearing at P16. Scale bars are 10 μm. C, Quantification of area exhibiting SC-to-HC conversion as a function of postnatal age (n = 4 for P4 and P8, n = 5 for P12, n = 3 for P16 and n = 3 for P82).

References

    1. Bermingham NA, Hassan BA, Price SD, Vollrath MA, Ben-Arie N, Eatock RA, Bellen HJ, Lysakowski A, Zoghbi HY. Math1: an essential gene for the generation of inner ear hair cells. Science. 1999;284:1837–1841. - PubMed
    1. Brooker R, Hozumi K, Lewis J. Notch ligands with contrasting functions: Jagged1 and Delta1 in the mouse inner ear. Development. 2006;133:1277–1286. - PubMed
    1. Burns J, Christophel JJ, Collado MS, Magnus C, Carfrae M, Corwin JT. Reinforcement of cell junctions correlates with the absence of hair cell regeneration in mammals and its occurrence in birds. J Comp Neurol. 2008;511:396–414. - PMC - PubMed
    1. Cavey M, Rauzi M, Lenne PF, Lecuit T. A two-tiered mechanism for stabilization and immobilization of E-cadherin. Nature. 2008;453:751–756. - PubMed
    1. Chausovsky A, Bershadsky AD, Borisy GG. Cadherin-mediated regulation of microtubule dynamics. Nat Cell Biol. 2000;2:797–804. - PubMed

Publication types

MeSH terms