. 2011 Sep 6;108(36):14992-7.
doi: 10.1073/pnas.1103202108. Epub 2011 Aug 17.

Cis-regulatory code of stress-responsive transcription in Arabidopsis thaliana

Affiliations

Cis-regulatory code of stress-responsive transcription in Arabidopsis thaliana

Cheng Zou et al. Proc Natl Acad Sci U S A. .

Abstract

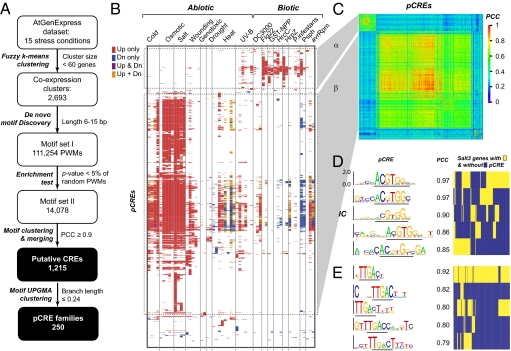
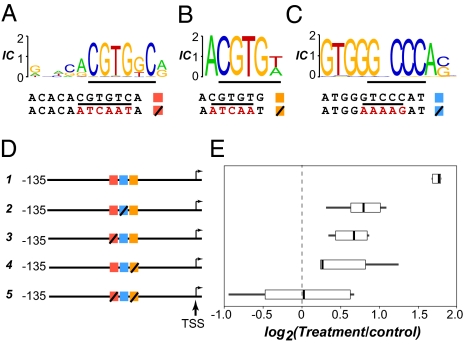
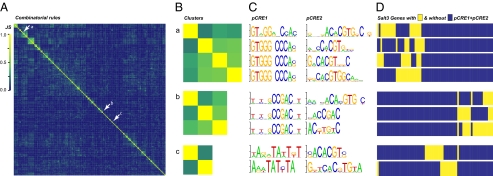
Environmental stress leads to dramatic transcriptional reprogramming, which is central to plant survival. Although substantial knowledge has accumulated on how a few plant cis-regulatory elements (CREs) function in stress regulation, many more CREs remain to be discovered. In addition, the plant stress cis-regulatory code, i.e., how CREs work independently and/or in concert to specify stress-responsive transcription, is mostly unknown. On the basis of gene expression patterns under multiple stresses, we identified a large number of putative CREs (pCREs) in Arabidopsis thaliana with characteristics of authentic cis-elements. Surprisingly, biotic and abiotic responses are mostly mediated by two distinct pCRE superfamilies. In addition, we uncovered cis-regulatory codes specifying how pCRE presence and absence, combinatorial relationships, location, and copy number can be used to predict stress-responsive expression. Expression prediction models based on pCRE combinations perform significantly better than those based on simply pCRE presence and absence, location, and copy number. Furthermore, instead of a few master combinatorial rules for each stress condition, many rules were discovered, and each appears to control only a small subset of stress-responsive genes. Given there are very few documented interactions between plant CREs, the combinatorial rules we have uncovered significantly contribute to a better understanding of the cis-regulatory logic underlying plant stress response and provide prioritized targets for experimentation.


Conflict of interest statement

The authors declare no conflict of interest.

Figures

Fig. 1.
Fig. 1.
Putative CRE (pCRE) identification pipeline and pCREs relevant to differential gene expression under various stress conditions. (A) pCRE identification pipeline. P value, Fisher's exact test; PCC, Pearson's correlation coefficient; PWM, position weight matrix. (B) pCREs significantly enriched in the promoters of differentially regulated genes for each condition and treatment duration (latter not labeled). The pCREs were ordered according to results of complete linkage clustering of the enrichment patterns across conditions. Up only, pCREs enriched among up-regulated genes; down (Dn) only, pCREs enriched in down-regulated genes; Up & Dn, pCRE enriched in both; Up + Dn, pCRE enrichment only when up- and down-regulated genes are jointly considered. Dotted rectangles: two major pCRE clusters α and β. (C) PCC matrix indicating the degrees of similarity between pCRE PWMs. The ordering of pCREs is the same as in B. The gray areas indicate the correspondence of the α- and β-clusters. (D) Sequence logos of example pCREs and their similarities (PCC) to ABRE (Left and Middle). IC: information content. (Right) Presence of example pCREs in the promoters of salt-3h up-regulated genes. Each column represents one gene and whether its promoter contains the pCRE in question (yellow) or not (blue). Only genes containing one or more example pCREs are shown. (E) Sequence logos and similarities of example pCREs to W-box (Left and Middle). (Right) Presence of example pCRE sites in the promoters of flagellin-1h up-regulated genes.
Fig. 2.
Fig. 2.
Positional bias and conservation of pCREs. (A) Log ratio (base 2, y axis) between the number of times that a pCRE is present in promoters of genes responsive to the condition in question in a 100-bp bin (ObsR, observed responsive) and the number of occurrences of X in random sequences generated on the basis of the nucleotide composition in the same bin (ExpB, expected in a bin). The log-ratio value was generated for each pCRE enriched among genes responsive to a particular condition at a particular time. The x axis indicates regions up to 1 kb upstream and 500 bp downstream of the TSS. Black line: the median log ratios for all pCREs. Gray area: the first and third quartiles of the log-ratio values. (B) Log ratios between the observed occurrence of pCREs in genes not responsive to any condition (ObsNR, observed nonresponsive) and the expected number of occurrences of pCREs in random sequences in each location bin. (C) Conservation score distributions of the sites of an example pCRE (sequence logo shown in Inset; IC, information content) and its randomized counterpart (rpCRE). (D) Distribution of log ratios between the median conservation scores (MCS) of pCRE sites and sites where their randomized counterparts (rpCREs) are located.
Fig. 3.
Fig. 3.
Experimental verification of the contribution of two pCREs similar to ABRE and one previously unknown pCRE to ANAC019 salt-responsive transcription. (A) The sequence logo is shown for SamNSmyACGTGkCr, a pCRE similar to ABRE (Dataset S2). Alignments below the logo indicate the original and modified (in red) sequences in truncated promoter–β-glucuronidase fusion constructs. Construct 1: original genomic sequences −135 bp to the TSS. Constructs 2–5: construct 1 with modified pCRE sites. (B) The sequence logo and original/modified sequences of ACGTGw, another pCRE similar to ABRE (Dataset S2). (C) The sequence logo and original/modified sequences of a previously unknown pCRE, GTGGGNCCCAS. (D) Schematic representations of five truncated promoter–reporter fusions (not drawn to scale). The colored and checked boxes indicate the original and modified pCRE sites, respectively, following the color keys next to the alignments in A, B, and C. (E) Log-ratio (base 2) boxplots of β-glucuronidase activities between salt-treated and control samples.
Fig. 4.
Fig. 4.
Performance of stress-response predictive models. (A) The precision-recall curves of Salt3 response predictive models based on known CRE presence/absence (known P/A), pCRE presence/absence (pCRE P/A), and pCRE combinatorial rules (pCRE CR). Arrows: precision and recall based on presence or absence of DRE-like or ABRE-like elements. (B) Precision-recall curves of predictive models for UV1. (C) Precision-recall curves of predictive models for Flg1. (D) The SVM weight of each location bin considering all pCREs jointly in predicting Salt3-responsive gene expression. The higher the weight is, the more important a location bin is in predicting high-salinity–induced expression. (E) Distribution of SVM weights generated from models considering only presence or absence (black bar) and copy number (white bars). (F) Precision-recall curves of predictive models for Salt3-responsive genes up-regulated by two- to three- (blue), three- to six- (orange), and more than sixfold (green). In all plots except E, the thick lines represent the mean and the whiskers represent ±SD in 10 SVM runs.
Fig. 5.
Fig. 5.
Similarities between Salt3 pCRE combinatorial rules. (A) Pairwise similarity between combinatorial rules. For each rule specifying a pair of pCREs, a vector was generated consisting of presence (1) and absence (0) of sites of both pCREs in the promoters of Salt3-responsive genes. Using these presence/absence vectors, pairwise Jaccard similarities (JS) between combinatorial rules were calculated (Methods) and used for hierarchical clustering. The x and y axes contain pCRE combinatorial rules in the same order. Yellow, a complete overlap between genes containing distinct binary combinations; deep blue, no overlap. Arrows: example clusters: a, previously unknown element + ABRE-like; b, DRE-like + ABRE-like; c, EVENING element-like + ABRE-like. (B) Jaccard similarities between combinatorial rules in the example clusters (a, b, and c as indicated in A). The heat maps represent magnified views as in A. (C) The sequence logos of pCREs found in the example binary combinations. Each row represents one unique pCRE combination in the same order as in B. (D) Genes with (yellow) and without (blue) a particular binary combination (in the same order as in B). Each column represents the same gene. Only genes with one or more combinations in cluster a, b, or c are shown.

References

    1. Boyer JS. Plant productivity and environment. Science. 1982;218:443–448. - PubMed
    1. Bradshaw AD. Evolutionary significance of phenotypic plasticity in plants. Adv Genet. 1965;13:115–155.
    1. Marcotte WR, Jr, Russell SH, Quatrano RS. Abscisic acid-responsive sequences from the em gene of wheat. Plant Cell. 1989;1:969–976. - PMC - PubMed
    1. Mundy J, Yamaguchi-Shinozaki K, Chua NH. Nuclear proteins bind conserved elements in the abscisic acid-responsive promoter of a rice rab gene. Proc Natl Acad Sci USA. 1990;87:1406–1410. - PMC - PubMed
    1. Yamaguchi-Shinozaki K, Shinozaki K. A novel cis-acting element in an Arabidopsis gene is involved in responsiveness to drought, low-temperature, or high-salt stress. Plant Cell. 1994;6:251–264. - PMC - PubMed

Publication types

MeSH terms

LinkOut - more resources