

Computational repositioning of the anticonvulsant topiramate for inflammatory bowel disease
- PMID: 21849664
- PMCID: PMC3479650
- DOI: 10.1126/scitranslmed.3002648
Computational repositioning of the anticonvulsant topiramate for inflammatory bowel disease
Abstract
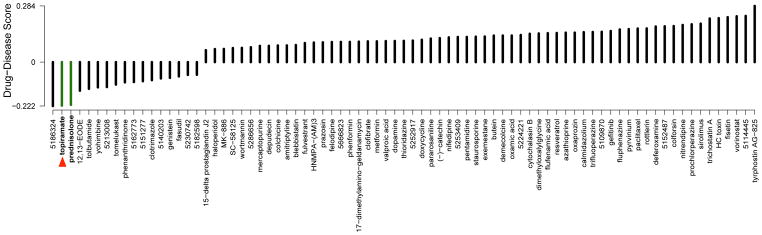
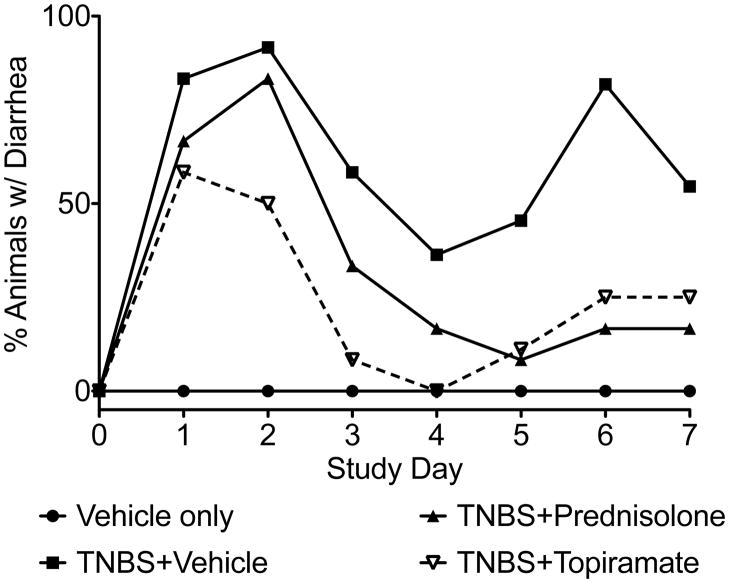
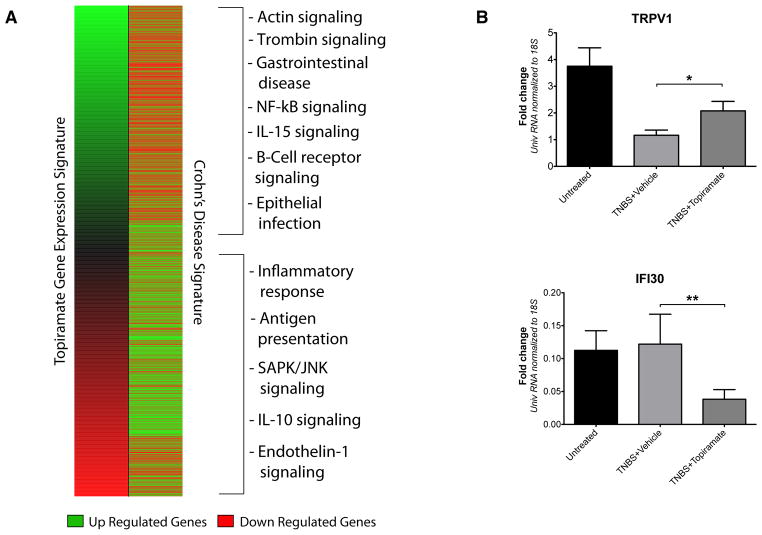
Inflammatory bowel disease (IBD) is a chronic inflammatory disorder of the gastrointestinal tract for which there are few safe and effective therapeutic options for long-term treatment and disease maintenance. Here, we applied a computational approach to discover new drug therapies for IBD in silico, using publicly available molecular data reporting gene expression in IBD samples and 164 small-molecule drug compounds. Among the top compounds predicted to be therapeutic for IBD by our approach were prednisolone, a corticosteroid used to treat IBD, and topiramate, an anticonvulsant drug not previously described to have efficacy for IBD or any related disorders of inflammation or the gastrointestinal tract. Using a trinitrobenzenesulfonic acid (TNBS)-induced rodent model of IBD, we experimentally validated our topiramate prediction in vivo. Oral administration of topiramate significantly reduced gross pathological signs and microscopic damage in primary affected colon tissue in the TNBS-induced rodent model of IBD. These findings suggest that topiramate might serve as a therapeutic option for IBD in humans and support the use of public molecular data and computational approaches to discover new therapeutic options for disease.
Figures

Comment in
-
The emergence of genome-based drug repositioning.Sci Transl Med. 2011 Aug 17;3(96):96ps35. doi: 10.1126/scitranslmed.3001512. Sci Transl Med. 2011. PMID: 21849663 Free PMC article.
-
Genetic signatures uncover new uses.Nat Rev Drug Discov. 2011 Sep 16;10(10):732-3. doi: 10.1038/nrd3565. Nat Rev Drug Discov. 2011. PMID: 21921920 No abstract available.
-
Signatures for drug repositioning.Nat Rev Genet. 2011 Sep 16;12(10):668. doi: 10.1038/nrg3076. Nat Rev Genet. 2011. PMID: 21921924 No abstract available.
-
Fast routes to new therapies: what do epilepsy and inflammatory bowel disease have in common?Gastroenterology. 2012 Mar;142(3):670-1. doi: 10.1053/j.gastro.2012.01.018. Epub 2012 Jan 24. Gastroenterology. 2012. PMID: 22281276 No abstract available.
References
-
- Loftus EV., Jr Clinical epidemiology of inflammatory bowel disease: Incidence, prevalence, and environmental influences. Gastroenterology. 2004 May;126:1504. - PubMed
-
- Baumgart DC, Sandborn WJ. Inflammatory bowel disease: clinical aspects and established and evolving therapies. Lancet. 2007 May 12;369:1641. - PubMed
-
- Sands BE, et al. Infliximab maintenance therapy for fistulizing Crohn’s disease. N Engl J Med. 2004 Feb 26;350:876. - PubMed
-
- Lamb J, et al. The Connectivity Map: using gene-expression signatures to connect small molecules, genes, and disease. Science. 2006 Sep 29;313:1929. - PubMed
Publication types
MeSH terms
Substances
Grants and funding
LinkOut - more resources
Full Text Sources
Other Literature Sources
