. 2011 Sep 15;187(6):3186-97.
doi: 10.4049/jimmunol.1101649. Epub 2011 Aug 17.

Regulatory T cells selectively control CD8+ T cell effector pool size via IL-2 restriction

Affiliations

Regulatory T cells selectively control CD8+ T cell effector pool size via IL-2 restriction

Wolfgang Kastenmuller et al. J Immunol. .

Abstract

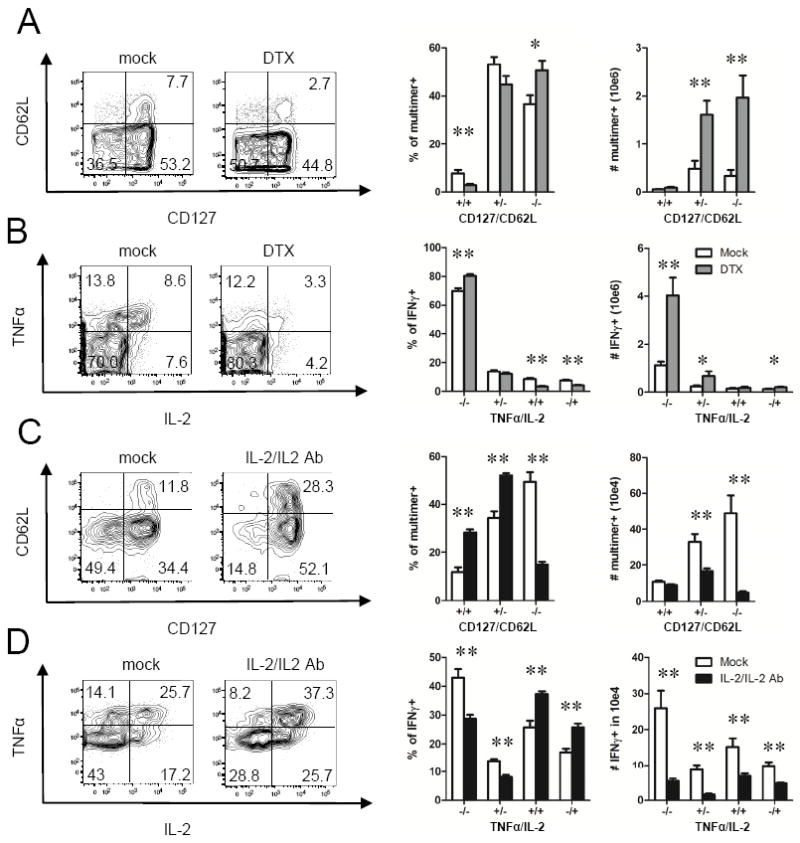
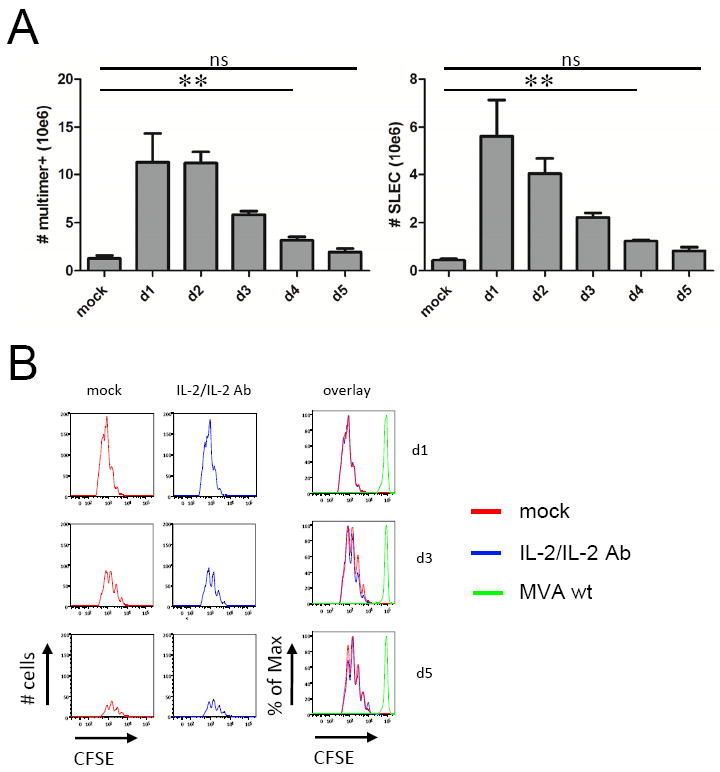
Regulatory T cells (Treg) are key players in maintaining immune homeostasis but have also been shown to regulate immune responses against infectious pathogens. Therefore, Treg are a promising target for modulating immune responses to vaccines to improve their efficacy. Using a viral vector system, we found that Treg act on the developing immune response early postinfection by reducing the extent of dendritic cell costimulatory molecule expression. Due to this change and the lower IL-2 production that results, a substantial fraction of CD8(+) effector T cells lose CD25 expression several days after activation. Surprisingly, such Treg-dependent limitations in IL-2 signaling by Ag-activated CD8(+) T cells prevent effector differentiation without interfering with memory cell formation. In this way, Treg fine-tune the numbers of effector T cells generated while preserving the capacity for a rapid recall response upon pathogen re-exposure. This selective effect of Treg on a subpopulation of CD8(+) T cells indicates that although manipulation of the Treg compartment might not be optimal for prophylactic vaccinations, it can be potentially exploited to optimize vaccine efficacy for therapeutic interventions.


Figures

Figure 1
Figure 1
Treg regulate primary but not memory or recall responses Groups of mice (n=4) were immunized with MVA OVA i.p. and were analyzed for antigen-specific CD8+ T cell responses in the spleen on d8 (A,B), d60 (E,F), d6 post recall (G,H) or over time in the blood (C,D). DEREG mice were treated with DTX or mock-treated (A,C,E,G) and C57BL/6 mice were treated with IL-2/IL-2 antibody complexes or mock-treated on d-3 (B,D,F,H). CD8+ T cell responses were analyzed using B8R and OVA specific multimers or ex vivo restimulation with B8R, OVA, A3L and control peptides followed by intracellular IFNγ staining. C and D show kinetic analysis of B8R specific multimer binding CD8+ T cells in the blood of immunized DEREG (C) or C57BL/6 (D) mice. Data are representative of three independent experiments. Bars show mean values, error bars show SEM, *p < 0.05, ** p < 0.01.
Figure 2
Figure 2
Treg control the size of the monofunctional, short-lived effector T cell pool. Groups of mice (n=4) were immunized with MVA OVA i.p. and analyzed on d8. DEREG mice were treated with DTX or mock-treated on d1- d3 (A and B) and C57BL/6 mice were treated with IL-2/IL-2 antibody complexes or mock-treated on d-3 (C and D). A and C show representative plots and graphs with relative and absolute numbers of CD62L and/or CD127 expression of T cells binding to B8R loaded multimers. B and D show representative plots and graphs with relative and absolute numbers of IL-2 and/or TNFα producing, IFNγ+ cells after stimulation with B8R peptide. Data are representative of 5 independent experiments of each type. Bars show mean values, error bars show SEM, *p < 0.05, * p < 0.01.
Figure 3
Figure 3
Treg suppress CD8+ T cell responses largely independent of IL-10 or TGF-β Groups of IL-10 KO mice (n=4) were immunized with MVA OVA i.p. and treated with IL-2/IL-2 antibody complexes or mock-treated on d-3. (A) shows the relative numbers IFNγ producing CD8+ T cells after restimulation with the respective peptides on d8 post priming. (B) Groups of mice (n=4) were immunized with MVA OVA i.p. and treated with IL-2/IL-2 antibody complexes or mock-treated on d-3 and/or IL-10R blocking antibody on d0. Graphs shows analysis of shows the relative numbers IFNγ producing CD8+ T cells after restimulation with the respective peptides, or total numbers of multimer (B8R) binding CD8+ T cell subsets at d8. (C) Groups of mice (n=4) were immunized with MVA OVA i.p. and treated with IL-2/IL-2 antibody complexes or mock-treated on d-3 and/or a TGF-β kinase inhibitor on d0, d1, d3, d5 and d7. Graphs shows analysis of shows the relative numbers IFNγ producing CD8+ T cells after restimulation with the respective peptides, or total numbers of multimer (B8R) binding CD8+ T cell subsets at d8. Data are representative of three independent experiments. Bars show mean values, error bars show SEM, * p< 0.05, ** p< 0.01.
Figure 4
Figure 4
Treg regulate early during the immune response but don’t inhibit initial proliferation of antigen-specific CD8+ T cells in vivo. (A) Groups of DEREG mice (n=4) were immunized with MVA OVA i.p. and analyzed for multimer+ B8R specific immune response on d8 post immunization. Days on the x-axis represent initiation of Treg depletion (for 3 consecutive days) post priming. Data show total numbers of B8R specific T-cells and numbers of SLEC (CD62L-/CD127-). (B) Groups of B6 mice (n=3) were immunized with MVA OVA i.p. and treated with IL-2/IL-2 antibody complexes or mock on d-3 before priming. After different time-points post immunization (d1, d3 or d5), CFSE labeled OT-1 T cells and CTB labeled control splenocytes were transferred and CFSE dilution was assessed 3 days later. Cell counts were normalized to co-transferred control population to allow for estimation of differences in absolute OT-1 T cell numbers. Data are representative of 3 independent experiments. Bars show mean values, error bars show SEM, ** p< 0.01, ns=not significant.
Figure 5
Figure 5
Treg depress CD25 expression and IL-2 production in antigen-specific CD8+ T cells. Groups of mice (n=4) were immunized with MVA OVA i.v. and treated with IL-2/IL-2 antibody complexes or mock-treated for three consecutive days prior to immunization. OT-1 T cells were transferred on d-1 (2x10e6 for 8h and 24h, 4x 10e5 for 48h and 72h) and analyzed in the spleen at different time-points post priming. A shows representative histograms of CD25 (upper panel) or CD69 (lower panel) expression on OT-1 T cells over time. Bar graph shows % of CD25 hi OT-1 T cells after 48h and 72h p.i. B shows quantitative qPCR of IL-2 mRNA from total spleen lysates from mice using the same experimental set-up as in A. C shows a representative plot and bar graphs of mean florescent intensities of cytokines produced by OT-1 cells 12h pi after 5h ex vivo culture in the presence of brefeldin A without further stimulation. D and E shows total numbers of IFNγ producing cells upon restimulation with the respective peptides or total numbers of multimer (B8R) binding CD8+ T cell subsets at d8. Graphs compare mock treated mice or animals, which received IL-2/IL-2 antibody complexes 48h and 72h post priming. Data are representative of three independent experiments. Bars show mean values, error bars show SEM, * p< 0.05, ** p< 0.01.
Figure 6
Figure 6
Treg depress CD80 and CD86 expression on DC in a manner dependent on CTLA-4 and independent of MHCII. (A) Groups of mice (n=3) were immunized with MVA wt or PBS i.v.and treated with IL-2/IL-2 antibody complexes or mock-treated for three days prior to immunization. Anti-CTLA-4 blocking antibody or isotype control was injected one day before and at the time of immunization. 24h later splenic DC were analyzed. Data show representative histograms of Foxp3 in CD4+ T-cells and CD86, CD80 MHCII and CD70 on CD11c hi cells, respectively. (B) Triple bm-chimeras (n=3) (CD40 KO, MHCII KO and wt) were immunized with MVA wt i.v. and treated with IL-2/IL-2 antibody complexes or mock for three consecutive days prior to immunization. 24h later splenic DC were analyzed. Histograms show representative analysis of CD86 and CD80 expression by CD11c hi cells from three independent experiments.
Figure 7
Figure 7
CD86 signaling is required for optimal IL-2 production in antigen-specific CD8+ T cells Groups of mice (n=5) received anti-CD86 or isotype antibodies 3h before i.p immunization with MVA OVA and CD8+ T cell immune response were analyzed in the spleen on d8. Graphs show relative numbers of IFNγ producing CD8+ T cells after restimulation with the respective peptides (A) or total numbers of multimer (B8R) binding CD8+ T cell subsets (B). C shows a representative bar graph of mean florescent intensities of cytokines produced by OT-1 cells 12h pi after 5h ex vivo culture in the presence of brefeldin A without further stimulation. D and E show analysis of CD8+ T cell immune responses in WT or CD86 KO animals. Graphs show relative numbers of IFNγ producing CD8+ T cells after restimulation with the respective peptides (C) or total numbers of multimer (B8R) binding CD8+ T cell subsets (D). Data are representative of two (CD86 KO) or three (anti CD86) independent experiments. Bars show mean values, error bars show SEM, * p< 0.05, ** p< 0.01.

References

    1. Brunkow ME, Jeffery EW, Hjerrild KA, Paeper B, Clark LB, Yasayko SA, Wilkinson JE, Galas D, Ziegler SF, Ramsdell F. Disruption of a new forkhead/winged-helix protein, scurfin, results in the fatal lymphoproliferative disorder of the scurfy mouse. Nat Genet. 2001;27:68–73. - PubMed
    1. Rubtsov YP, Rasmussen JP, Chi EY, Fontenot J, Castelli L, Ye X, Treuting P, Siewe L, Roers A, Henderson WR, Jr, Muller W, Rudensky AY. Regulatory T cell-derived interleukin-10 limits inflammation at environmental interfaces. Immunity. 2008;28:546–558. - PubMed
    1. Li MO, Wan YY, Flavell RA. T cell-produced transforming growth factor-beta1 controls T cell tolerance and regulates Th1- and Th17-cell differentiation. Immunity. 2007;26:579–591. - PubMed
    1. Read S, Greenwald R, Izcue A, Robinson N, Mandelbrot D, Francisco L, Sharpe AH, Powrie F. Blockade of CTLA-4 on CD4+CD25+ regulatory T cells abrogates their function in vivo. J Immunol. 2006;177:4376–4383. - PMC - PubMed
    1. Wing K, Onishi Y, Prieto-Martin P, Yamaguchi T, Miyara M, Fehervari Z, Nomura T, Sakaguchi S. CTLA-4 control over Foxp3+ regulatory T cell function. Science. 2008;322:271–275. - PubMed

Publication types