. 2012 Feb;6(2):298-308.
doi: 10.1038/ismej.2011.107. Epub 2011 Aug 18.

Defining seasonal marine microbial community dynamics

Affiliations

Defining seasonal marine microbial community dynamics

Jack A Gilbert et al. ISME J. 2012 Feb.

Abstract

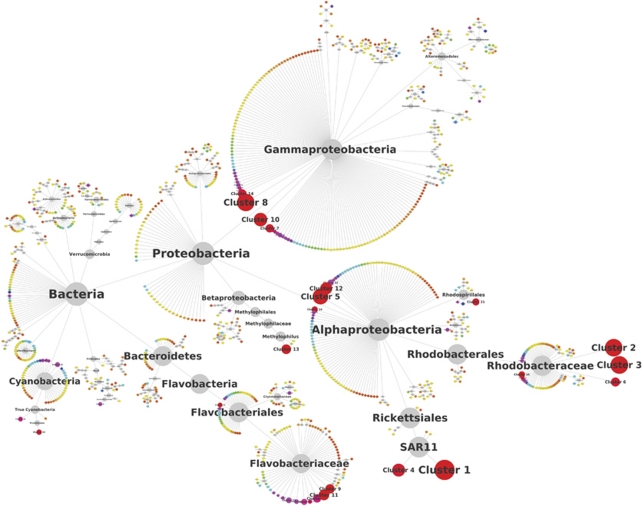
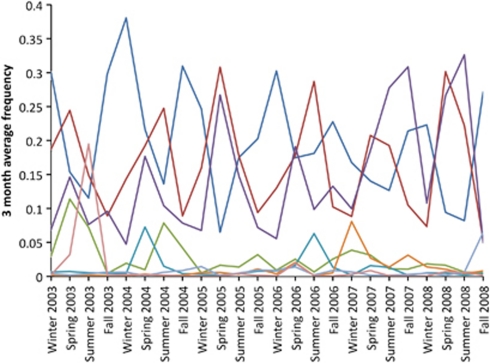
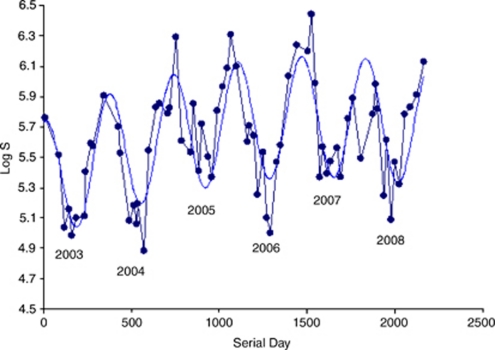
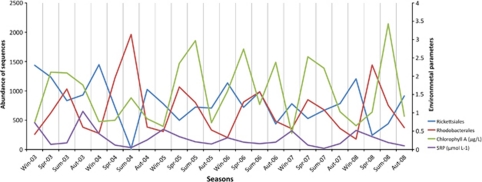
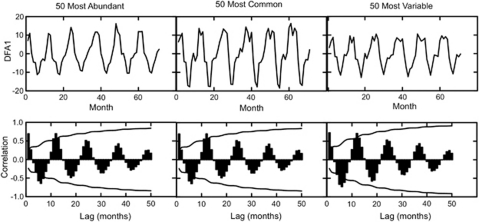
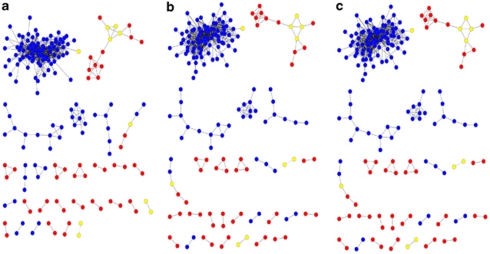
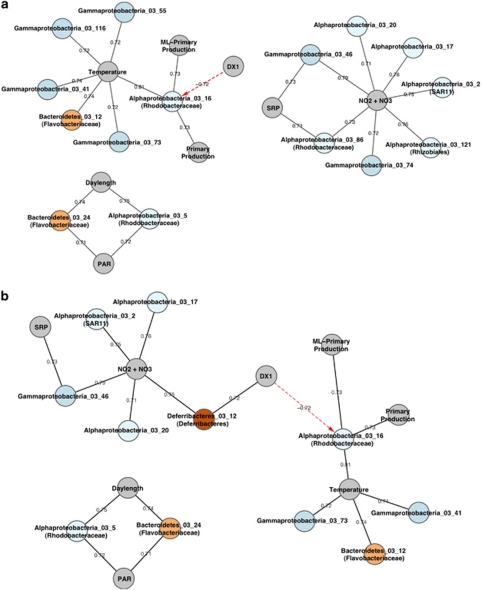
Here we describe, the longest microbial time-series analyzed to date using high-resolution 16S rRNA tag pyrosequencing of samples taken monthly over 6 years at a temperate marine coastal site off Plymouth, UK. Data treatment effected the estimation of community richness over a 6-year period, whereby 8794 operational taxonomic units (OTUs) were identified using single-linkage preclustering and 21 130 OTUs were identified by denoising the data. The Alphaproteobacteria were the most abundant Class, and the most frequently recorded OTUs were members of the Rickettsiales (SAR 11) and Rhodobacteriales. This near-surface ocean bacterial community showed strong repeatable seasonal patterns, which were defined by winter peaks in diversity across all years. Environmental variables explained far more variation in seasonally predictable bacteria than did data on protists or metazoan biomass. Change in day length alone explains >65% of the variance in community diversity. The results suggested that seasonal changes in environmental variables are more important than trophic interactions. Interestingly, microbial association network analysis showed that correlations in abundance were stronger within bacterial taxa rather than between bacteria and eukaryotes, or between bacteria and environmental variables.


Figures

Figure 1
Figure 1
Persistence of OTUs in microbial communities at L4 over a 6-year time period. Median OTU abundance, calculated for all time points, over a 6-year period is set proportional to node size on a logarithmic scale. Only OTUs found in at least 5% of the time-series samples (⩾4) are shown. This includes 22.53% of the OTUs, representing 97.48% of the sampled organisms. Node coloring shows the differences in persistence over time, with the color scale from orange (5%), yellow (16%), green (35%), blue (66%), red (100%) reflecting increasing persistence.
Figure 2
Figure 2
Plot representing the seasonal dynamics (grouped as an average of seasons; Winter: January–March; Spring: April–June; Summer: July–September; Fall: October–December) of taxa grouped at the taxonomic level of Order in the L4 6-year time series. Frequency is recorded based on abundances within a resampled abundance of 4101 sequences per sample. Only Orders whose average frequency peaked above 10% of the resampled community abundance were included.
Figure 3
Figure 3
Alpha diversity (observed OTUs) plotted as the log of species richness (S) by month spanning 6 years of marine water sampling at the L4 site in the Western English Channel. A cyclic pattern is observed in alpha-diversity, with species richness peaking in the winter months.
Figure 4
Figure 4
Plot representing the seasonal dynamics of the bacterial Orders, Rickettsiales and Rhodobacterales, and environmental parameters, chlorophyll a and soluble reactive phosphorus (SRP) in the L4 6-year time series. Frequency is recorded based on abundances (abundance of sequences per taxa) within a resampled abundance of 4505 sequences per sample.
Figure 5
Figure 5
Annual repeating patterns from the bacterioplankton community sampled monthly from 2003–2008 in the English Channel determined by DFA where the model used the bacterioplankton community to predict the month. Upper row of graphs shows the time-series analysis of the first discriminant function (DFA1) over 72 months. The lower row shows the autocorrelation of the discriminant function with up to a 50-month lag. The lines in the lower row represent correlations with P<0.05.
Figure 6
Figure 6
Broad view of correlation network for the microbial community and the environment at station L4. The network shows strong correlations (r>0.8, P<0.001, q<0.002) between microbial and environmental parameters for the 300 most abundant bacterial taxa (a), the 300 most common bacterial taxa (b), and the 300 most variable bacterial taxa (c). Bacteria are shown in blue, eukaryotes are shown in red and environmental variables are shown in yellow.
Figure 7
Figure 7
Sub-networks of highly correlated (r>0.7, P<0.001) variables built around environmental factors from the 50 most common (a) and 50 most variable (b) bacterial OTUs. Interactions between environmental variables and eukaryotic interactions with environmental variables have been removed for clarity. OTU identifications are from http://vampsarchive.mbl.edu/diversity/diversity_old.php. Identifications more specific than the taxonomic order are shown in parentheses. Solid lines represent positive correlations, dashed lines represent negative correlations. Black lines show no time delay while red arrows are delayed by 1 month.

References

    1. Caporaso JG, Lauber CL, Walters WA, Berg-Lyons D, Lozupone CA, Turnbaugh PJ, et al. Global patterns of 16S rRNA diversity at a depth of millions of sequences per sample. Proc Natl Acad Sci USA. 2011;108 (Suppl 1:4516–4522. - PMC - PubMed
    1. Church MJ.2009Resource control of bacterial dynamics in the SeaIn: Kirchman DL (ed).Microbial Ecology of the Oceans Wiley & Sons Inc.: NJ, USA
    1. Clarke KR, Gorley RN. PRIMER v6: User Manual/Tutorial. Primer-E Ltd.: Plymouth, UK; 2006.
    1. Clarke KR, Warwick RM.2001Change in Marine Communities: An Approach to Statistical Analysis and Interpretation2nd edn.Primer-E Ltd: Plymouth, UK
    1. Costello EK, Lauber CL, Hamady M, Fierer N, Gordon JI, Knight R. Bacterial community variation in human body habitats across space and time. Science. 2009;326:1694–1697. - PMC - PubMed

Publication types

Substances