. 2011;6(8):e22818.
doi: 10.1371/journal.pone.0022818. Epub 2011 Aug 5.

Dysregulation in retinal para-inflammation and age-related retinal degeneration in CCL2 or CCR2 deficient mice

Affiliations

Dysregulation in retinal para-inflammation and age-related retinal degeneration in CCL2 or CCR2 deficient mice

Mei Chen et al. PLoS One. 2011.

Abstract

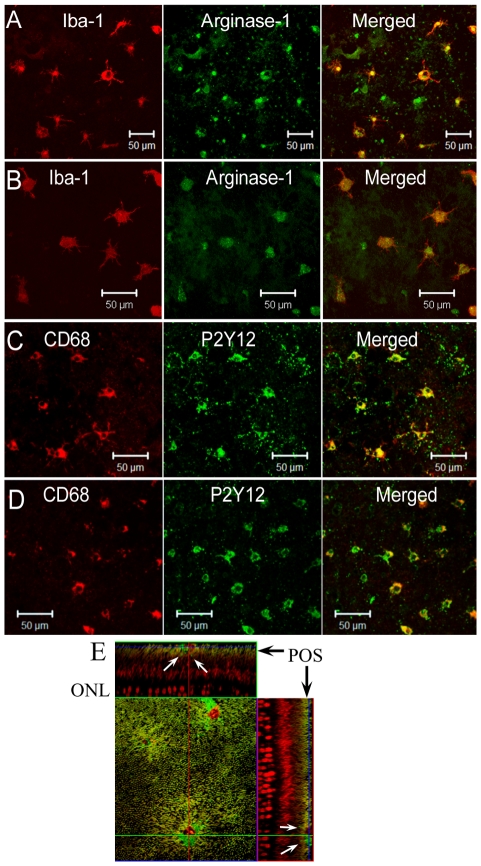
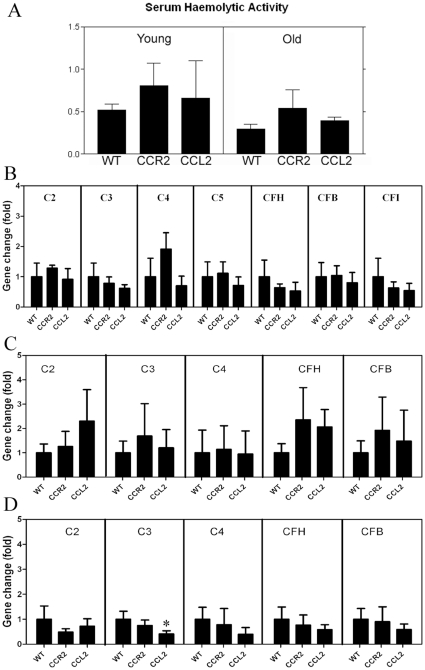
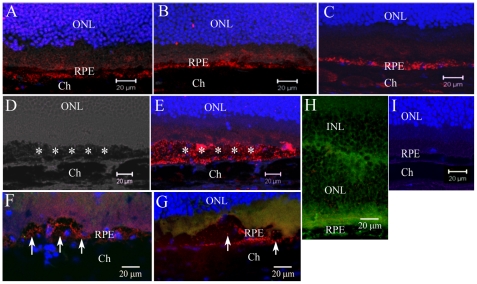
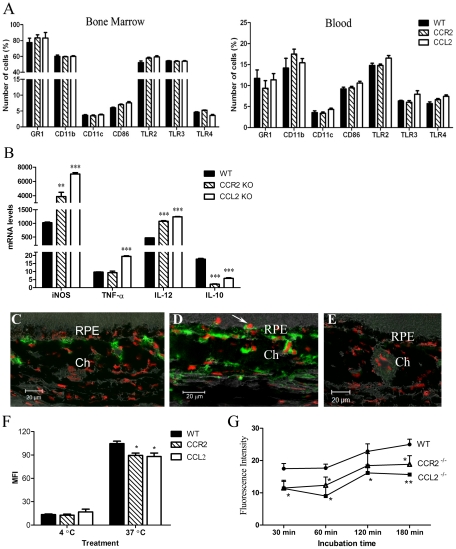
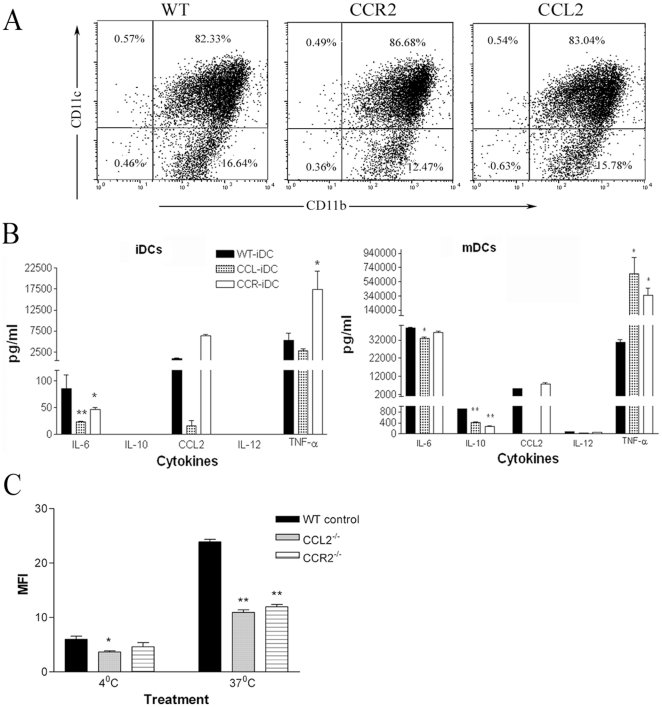
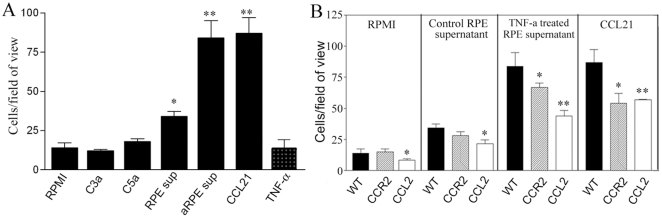
We have shown previously that a para-inflammatory response exists at the retinal/choroidal interface in the aging eye; and this response plays an important role in maintaining retinal homeostasis under chronic stress conditions. We hypothesized that dysregulation of the para-inflammatory response may result in an overt pro-inflammatory response inducing retinal degeneration. In this study, we examined this hypothesis in mice deficient in chemokine CCL2 or its cognate receptor CCR2. CCL2- or CCR2-deficient mice developed retinal degenerative changes with age, characterized as retinal pigment epithelial (RPE) cell and photoreceptor cell death. Retinal cell death was associated with significantly more subretinal microglial accumulation and increased complement activation. In addition, monocytes from CCL2- or CCR2-deficient mice had reduced capacity for phagocytosis and chemotaxis, expressed less IL-10 but more iNOS, IL-12 and TNF-α when compared to monocytes from WT mice. Complement activation at the site of RPE cell death resulted in C3b/C3d but not C5b-9 deposition, indicating only partial activation of the complement pathway. Our results suggest that altered monocyte functions may convert the protective para-inflammatory response into an overtly harmful inflammation at the retina/choroidal interface in CCL2- or CCR2-deficient mice, leading to RPE and photoreceptor degeneration. These data support a concept whereby a protective para-inflammatory response relies upon a normally functioning innate immune system. If the innate immune system is deficient chronic stress may tip the balance towards an overt inflammatory response causing cell/tissue damage.


Conflict of interest statement

Competing Interests: The authors have declared that no competing interests exist.

Figures

Figure 1
Figure 1. Fundus images of WT and CCL2 KO or CCR2 KO mice.
(A–F) TEFI images of a 3-month old WT mouse (A), 24-month old WT mouse (B), 24-month old CCR2 mice (C, E) and 24-month old CCL2 KO mice (D, F). Arrows in E and F show patches of retinal lesion. G and H, fluorescein angiography images of a 3-month old WT mouse (G) and a 24-month old WT mouse (H). Arrowhead in H shows a localized fluorescein leakage.
Figure 2
Figure 2. Histology of mouse eyes.
Mouse eyes were taken from 18–24 months old mice and processed for H-E staining. A–C, representative images of a 22-month WT (A) a 22-month CCL2 KO (B) and a 22-month CCR2 KO (C) mouse showing photoreceptors. D & E, quantitative analysis of the number of photoreceptor nuclei. D, a schematic image showing the locations where the photoreceptor nuclei were counted. E, the numbers of photoreceptor in 20–24 months old mice WT, CCL2- or CCR2-deficient mice. *, P<0.05 compared to the WT mice at the same location . Mean ± SEM, n = 8–10 eyes, ANOVA (Kruskal-Wallis test) followed by Dunn's multiple comparison test. F–I, Representative images from aged CCL2 KO (F), CCR2 KO (G), and WT (H) mice showing RPE vacuolation (arrows). I, the number of RPE vacuoles in different strains of mice. Mean ± SEM, n = 12 eyes, *, P<0.05; **, P<0.01. ANOVA Dunn's multiple comparison test. J & K, retinal images from a 20-month (J) and a 24-month (K) CCL2 KO mouse showing areas of RPE cell damage (arrowheads) and inflammatory cell infiltration (insert in J). A layer of pigmented cells on top of degenerated (damaged) RPE cells was observed in K.
Figure 3
Figure 3. TEM images of RPE/photoreceptor of different strains of mice.
A, an image from a 22-month old WT mouse showing RPE basal laminar deposits (asterisk). B, an image from 22-month old CCR2 KO mouse showing a photoreceptor outer segment (arrowhead) in parallel with RPE cells, multiple vacuoles (white arrows) in RPE cells and basal laminar deposits (asterisk). C, an image from a 22-month old CCL2 KO mouse showing multiple vacuoles in RPE cells (white arrows) and basal laminar deposits (asterisk). D, an image from a 24-month old CCL2 KO mouse showing multiple vacuoles and reduced melanin granules in degenerated RPE cells, basal laminar deposits (asterisk). E, an image from a 24-month old CCR2 KO mouse showing photoreceptor inner segment degeneration (black arrows), and a gap between RPE cells and photoreceptor outer segments. F, an image from a 20-month old CCL2 KO mouse showing photoreceptor inner segment degeneration (black arrows), reduced melanin granules in RPE cells and RPE basal laminar deposition (asterisk). G, an image from a 20-month old CCL2 KO mouse showing a patch of RPE atrophy, disorganised photoreceptor outer segments, a lack of choriocapillaris, and fibrotic tissues in the choroid (black asterisks). H and I, images from a 24-month old CCL2 KO mouse showing the loss of electron-dense materials in the cytoplasm, the loss of cytoplasm organelles and membrane, and a nucleus with reduced electron-dense materials in the RPE layer; choriocapillaris basal laminar deposition in the choroid; a layer of melanin granule-containing cells (block arrowheads) on top of the degenerated RPE cells with their process extending towards the photoreceptor outer segments. RPE, retinal pigment epithelia. (J), A confocal image of RPE/choroidal flatmount of a 24-month CCL2 KO mouse showing accumulation of macrophages/microglia at the site of RPE damage. RPE damages were highlighted with disorganised actins (phalloidin staining) and subretinal macrophages were labelled with Iba-1.
Figure 4
Figure 4. Subretinal microglia in different strains of mice.
A–D, Autofluorescent (AF) images of a 3-month WT mouse (A), a 24-month WT mouse (B), a 24-month old CCR2 KO mouse, (C) and a 24-month CCL2 KO mouse (D). E–G, confocal images of RPE flatmounts stained for microglia with Iba-1 antibody (see Methods) from a 20-month old WT mouse (E), a 20-month old CCR2 KO mouse (F) and a 20-month old CCL2 KO mouse (G). (H) The number of subretinal Iba-1+ microglia in 20-month old of different strains of mice. Mean ± SD, N = 8∼12. *, P<0.05 compared to WT, ANOVA Dunn's multiple comparison test. I, a TEM image from a CCL2 KO mouse showing a subretinal microglial cell (MG) with lipofuscin (arrows) on the surface of RPE cells.
Figure 5
Figure 5. Phenotype of subretinal macrophage/microglia.
RPE/choroidal flatmounts from aged (20–24 months) WT (A, C) and CCL2 KO (B, D) mice were dual stained for Iba-1/arginase-1 (A, B), or CD68/P2Y12 (C, D) and observed by confocal microscopy. Images presented are representatives from 6 mice in each group. E, Z-stack images of a retinal flatmount stained for Iba-1 (green) and Propidium iodide (PI) showing three Iba-1+ cells in the photoreceptor outer segment layer. Arrows: cell dendrites pointing toward the inner retina in z-sections.
Figure 6
Figure 6. Complement expression in different strains of mice.
A, Haemolytic activity of serum from different strains of mice. Mean ± SEM, N = 12 mice. B–D, complement gene expression in the liver (B), retina (C) and RPE/choroid (D) of different strains of 24-month old mice. Results are expressed as relative gene fold change of CCR2 KO or CCL2 KO mice against WT mice. Mean ± SEM, N = 6∼8, *, P<0.05 in comparison to WT mice, Dunnett's multiple comparison test.
Figure 7
Figure 7. C3d and C5b-9 deposition at the retina/choroidal interface of different strains of mice.
Cryosections of eyes from 22–24-month old mice were stained for C3d (red) or C5b-9 (green in F and G) and observed by confocal microscopy. A, an image from a 22-momth old WT mouse. B, an image from a 22-momth old CCR2 KO mouse. C, an image from a 22-momth old CCL2 KO mouse. D and E, images taken from a 24-momth old CCL2 KO mouse showing area of RPE cell death (asterisks) and extensive C3d deposition (red). F and G, images taken from a 24-momth old CCR2 KO mouse (F) and a 24-month old CCL2 KO mouse showing areas of RPE cell death (arrows) with C3d deposition (red), but no C5b-9 deposition (green). H, a retina from a mouse with EAU , was used as positive control for C5b-9 staining (green). I, Isotype control antibody staining for C3d in a 24-month CCL2 KO mouse showing no background staining. ONL, outer nuclear layer. RPE, retinal pigment epithelia. Ch, choroid.
Figure 8
Figure 8. Phenotype and function of myeloid-derived cells in different strains of mice.
A, Bone marrow and blood cells collected from different strains of mice were stained for different cell surface markers and analysed by flow cytometry. Mean ± SEM, N = 6. B, Cytokine gene expression in LPS stimulated BM-DMs of different strains of mice. Mean ± SEM, N = 3. *, P<0.05; **, P<0.01; compared to WT cells. Unpaired Student t test. Experiments were performed four times. C–D, Nitrotyrosine (green) and PI (red) staining in the eye of a 20-month old WT mouse (C) and a 20-month old CCL2 KO mouse (D). E, isotype control staining. Ch, choroid; RPE, retinal pigment epithelium. F, Endocytosis of BM-DMs using dextran method (see Materials & Methods). MFI, mean fluorescence intensity. G, Phagocytosis of E. coli by BM-DMs (see Materials & Methods). Mean ± SEM, N = 3. *, P<0.05, **, P<0.01 compared to WT cells of the same time point. Dunnett Multiple comparison test. Experiments were performed twice.
Figure 9
Figure 9. Phenotypes and functions of BM-DCs of different strains of mice.
A, The expression of CD11b and CD11c in bone marrow-derived dendritic cells (BMDCs) of different strains of mice. B, cytokine production by immature BM-DCs (iDC) and mature BM-DCs (mDC) of different strains of mice. C, endocytosis of FITC-dextran by iDC of different strains of mice. Mean ± SEM, n = 4. *, P<0.05, **, P<0.01 in comparison to WT cells. n = 4, unpaired Student t test.
Figure 10
Figure 10. Chemotaxis of bone marrow-derived dendritic cells (BMDCs).
A, migration of BMDCs of WT mice in response to different stimuli. *, P<0.05, **, P<0.01 in comparison to RPMI. Mean ± SEM, n = 3, Unpaired Student t test. B, the migration of BMDCs of different strains of mice in response to RPMI, RPE supernatant, TNF-a treated RPE supernatant and chemokine CCL21. *, P<0.05, **, P<0.01 in comparison to WT cells. Mean ± SEM, n = 3, Unpaired Student t test. Experiments were repeated twice.

Similar articles

Cited by

References

    1. Friedman DS, O'Colmain BJ, Munoz B, Tomany SC, McCarty C, et al. Prevalence of age-related macular degeneration in the United States. Arch Ophthalmol. 2004;122(4):564–572. - PubMed
    1. Coleman HR, Chan CC, Ferris FL, 3rd, Chew EY. Age-related macular degeneration. Lancet. 2008;372(9652):1835–1845. - PMC - PubMed
    1. Chakravarthy U, Adamis AP, Cunningham ET, Jr, Goldbaum M, et al. VEGF Inhibition Study in Ocular Neovascularization (V.I.S.I.O.N.) Clinical Trial Group. Year 2 efficacy results of 2 randomized controlled clinical trials of pegaptanib for neovascular age-related macular degeneration. Ophthalmology. 2006;113(9):1508.e1–1508.25. - PubMed
    1. Hughes MS, Sang DN. Safety and efficacy of intravitreal bevacizumab followed by pegaptanib maintenance as a treatment regimen for age-related macular degeneration. Ophthalmic Surg Lasers Imaging. 2006;37(6):446–454. - PubMed
    1. Bressler NM, Chang TS, Fine JT, Dolan CM, Ward J, et al. Improved vision-related function after ranibizumab vs photodynamic therapy: a randomized clinical trial. Arch Ophthalmol. 2009;127(1):13–21. - PubMed

MeSH terms