. 2011;6(8):e23266.
doi: 10.1371/journal.pone.0023266. Epub 2011 Aug 5.

Differing lectin binding profiles among human embryonic stem cells and derivatives aid in the isolation of neural progenitor cells

Affiliations

Differing lectin binding profiles among human embryonic stem cells and derivatives aid in the isolation of neural progenitor cells

Mahesh C Dodla et al. PLoS One. 2011.

Abstract

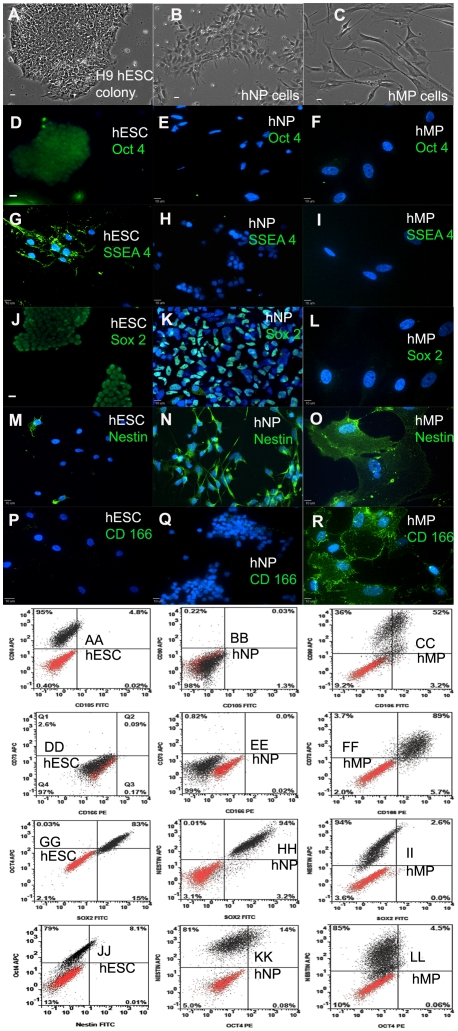
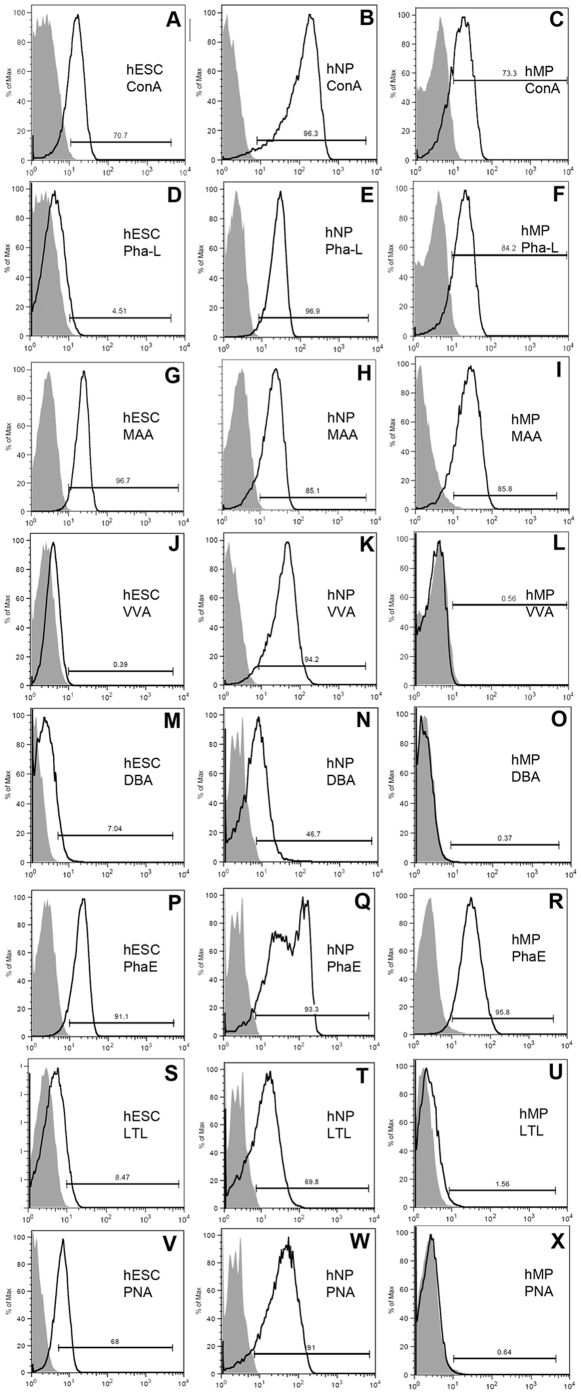
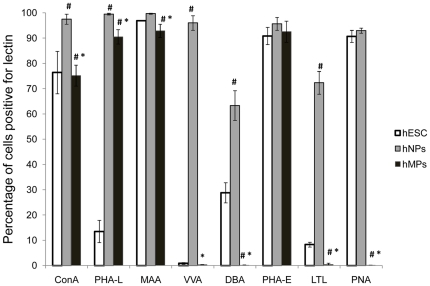
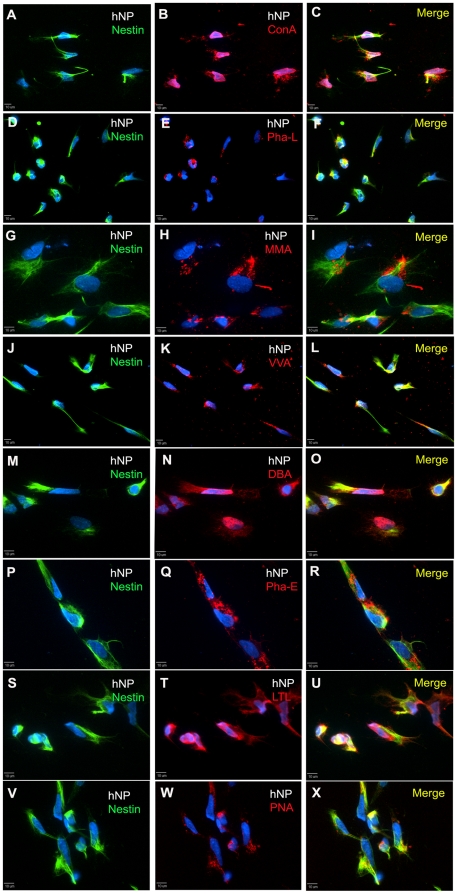
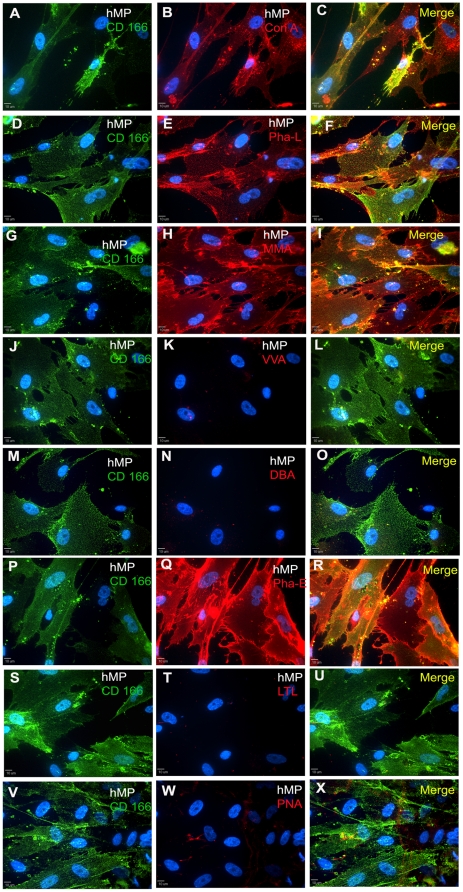
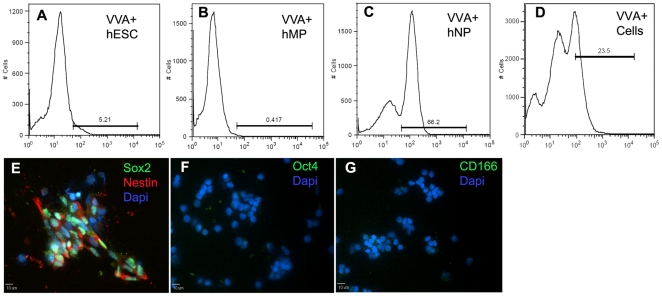
Human embryonic stem cells (hESCs) and their differentiated progeny allow for investigation of important changes/events during normal embryonic development. Currently most of the research is focused on proteinacous changes occurring as a result of differentiation of stem cells and little is known about changes in cell surface glycosylation patterns. Identification of cell lineage specific glycans can help in understanding their role in maintenance, proliferation and differentiation. Furthermore, these glycans can serve as markers for isolation of homogenous populations of cells. Using a panel of eight biotinylated lectins, the glycan expression of hESCs, hESCs-derived human neural progenitors (hNP) cells, and hESCs-derived mesenchymal progenitor (hMP) cells was investigated. Our goal was to identify glycans that are unique for hNP cells and use the corresponding lectins for cell isolation. Flow cytometry and immunocytochemistry were used to determine expression and localization of glycans, respectively, in each cell type. These results show that the glycan expression changes upon differentiation of hESCs and is different for neural and mesenchymal lineage. For example, binding of PHA-L lectin is low in hESCs (14±4.4%) but significantly higher in differentiated hNP cells (99±0.4%) and hMP cells (90±3%). Three lectins: VVA, DBA and LTL have low binding in hESCs and hMP cells, but significantly higher binding in hNP cells. Finally, VVA lectin binding was used to isolate hNP cells from a mixed population of hESCs, hNP cells and hMP cells. This is the first report that compares glycan expression across these human stem cell lineages and identifies significant differences. Also, this is the first study that uses VVA lectin for isolation for human neural progenitor cells.


Conflict of interest statement

Competing Interests: The authors have read the journal's policy and have the following conflicts. SLS and DWM hold positions at ArunA Biomedical Inc. NP cells and some media were provide in part by ArunA Biomedical (NP cells: hNP1TM cells, AB2TM medium supplemented with ANSTM). There are no patents, products in development or marketed products to declare. This does not alter the authors' adherence to all the PLoS ONE policies on sharing data and materials, as detailed online in the guide for authors.

Figures

Figure 1
Figure 1. Defining the stem cell phenotype using immunocytochemistry and flow cytometry.
Phase contrast image of hESCs (A), hNPs (B), and hMPs (C). hESCs express pluripotency markers: Oct 4 (D,GG, JJ), SSEA-4 (G), and Sox 2 (J,GG); lack expression of Nestin (M, JJ), CD 166 (P,DD), CD73 (DD), and CD105 (AA). hNPs have low expression of pluripotency markers: Oct 4 (E,KK), SSEA-4 (H); and mesenchymal markers CD 166 (Q,EE), CD73 (EE), and CD105 (BB). hNPs express neural markers: Sox 2 (J,HH) and Nestin (N,HH,KK). hMPs lack expression of pluripotency markers: Oct 4 (F,LL), SSEA-4 (I), and Sox 2 (L,II); however, hMPs express Nestin (O,II,LL), CD 166 (R,FF), CD73 (FF), CD90 (CC) and CD105 (CC). All the cells have been stained with the nuclear marker DAPI (blue) in panels D- P. Scale bar: 10 µm. In the dot plots, red dots indicate isotype control or secondary antibody only; black dots indicate the antigen staining.
Figure 2
Figure 2. Flow cytometry histograms of lectin binding in hESCs, hNPs and hMPs.
Percentage of cells binding to 8 different lectins was determined by flow cytometry. A representative lectin histogram plot is shown for one of 4 experimental replicates. In each panel far left grey fill peak in the histogram plot correlates with cells stained with secondary antibody only, and the shifted black tracing peak represents cells binding to a lectin. Panels in the left column show histograms of 8 different lectins binding to hESCs. Panels in the middle column are for hNP cells and panels in the right column are for hMP cells. Gating for each histogram indicates % of cells positive for the lectin-binding.
Figure 3
Figure 3. Quantification of lectin binding in hESC, hNP and hMP cell surfaces with 8 different lectins.
The percent of cells with specific carbohydrate expression was determined by flow cytometry using 8 different lectins. Each of the 3 cell types were separately stained with one of 8 lectins. The data is represented as average +/− SD of 4 independent assays of hESCs, hNP cells and hMP cells. Means with different letters are significantly different, # indicates p<0.05 compared to hESCs and * indicates p<0.05 compared to hNP cells.
Figure 4
Figure 4. Immunocytochemistry of hESC cultures for SSEA-4 expression and binding to lectins.
The panels in the left column show hESCs staining for SSEA-4 and DAPI (panels A, D, G, J, M, P, S, and V). In the same field of view as the left panel, the middle panels show binding of ConA(B), Pha-L (E), MMA (H), VVA (K), DBA (N), Pha-E (Q), LTL (T), and PNA (W) lectins in hESCs. The merge view of lectin and SSEA-4 staining is shown in panels in the right column. The staining amount roughly correlates with flow cytometry analysis. Scale bar: 10 µm.
Figure 5
Figure 5. Immunocytochemistry of hNP cell cultures for Nestin expression and binding to lectins.
The panels in the left column show hNP cells staining for Nestin and DAPI (panels A, D, G, J, M, P, S, and V). In the same field of view as the left panel, the middle panels show binding of ConA(B), Pha-L (E), MMA (H), VVA (K), DBA (N), Pha-E (Q), LTL (T), and PNA (W) lectins in hNP cells. The merge view of lectin and Nestin staining is shown in panels in the right column. The staining amount roughly correlates with flow cytometry analysis. Scale bar: 10 µm.
Figure 6
Figure 6. Immunocytochemistry of hMP cell cultures for CD 166 expression and binding to lectins.
Binding of ConA(B), Pha-L (E), MMA (H), VVA(K), DBA(N), Pha-E (Q), LTL (T), and PNA (W) lectins in hMP cells. In the same field of view, CD 166 and DAPI staining is shown in panels in the left column. The merge view of lectin and CD 166 staining is shown in panels in the right column. The staining amount roughly correlates with flow cytometry analysis. Scale bar: 10 µm.
Figure 7
Figure 7. Fluorescence assisted cell sorting of hNPs using VVA lectin.
hMP cells (A), hESCs (B) and hNP cells (C) stained with VVA-fluorescein lectin, analyzed for binding and used as controls. A mixed population of hESCs, hNPs and hMPs (1∶1∶1 ratio) was stained with VVA-fluorescein lectin and sorted for fluorescein positive cells (D). The sorted cells stained positive for Nestin and SOX2 (E); and were negative for OCT4 (F), and CD166 (G). Cells were stained with DAPI for nucleus. Scale bar: 10 µm.

Similar articles

Cited by

References

    1. Shin S, Mitalipova M, Noggle S, Tibbitts D, Venable A, et al. Long-term proliferation of human embryonic stem cell-derived neuroepithelial cells using defined adherent culture conditions. Stem Cells. 2006;24(1):125–38. - PubMed
    1. Boyd NL, Robbins KR, Dhara SK, West FD, Stice SL. Human embryonic stem cell-derived mesoderm-like epithelium transitions to mesenchymal progenitor cells. Tissue Eng Part A. 2009;15(8):897–907. - PMC - PubMed
    1. Bain G, Ray WJ, Yao M, Gottlieb DI. Retinoic acid promotes neural and represses mesodermal gene expression in mouse embryonic stem cells in culture. Biochem Biophys Res Commun. 1996;223(3):691–4. - PubMed
    1. Mujtaba T, Piper DR, Kalyani A, Groves AK, Lucero MT, et al. Lineage-restricted neural precursors can be isolated from both the mouse neural tube and cultured ES cells. Dev Biol. 1999;214(1):113–27. - PubMed
    1. Muraglia A, Cancedda R, Quarto R. Clonal mesenchymal progenitors from human bone marrow differentiate in vitro according to a hierarchical model. J Cell Sci. 2000;113(Pt 7):1161–6. - PubMed

Publication types