. 2011;6(8):e23343.
doi: 10.1371/journal.pone.0023343. Epub 2011 Aug 5.

SLOB, a SLOWPOKE channel binding protein, regulates insulin pathway signaling and metabolism in Drosophila

Affiliations

SLOB, a SLOWPOKE channel binding protein, regulates insulin pathway signaling and metabolism in Drosophila

Amanda L Sheldon et al. PLoS One. 2011.

Abstract

There is ample evidence that ion channel modulation by accessory proteins within a macromolecular complex can regulate channel activity and thereby impact neuronal excitability. However, the downstream consequences of ion channel modulation remain largely undetermined. The Drosophila melanogaster large conductance calcium-activated potassium channel SLOWPOKE (SLO) undergoes modulation via its binding partner SLO-binding protein (SLOB). Regulation of SLO by SLOB influences the voltage dependence of SLO activation and modulates synaptic transmission. SLO and SLOB are expressed especially prominently in median neurosecretory cells (mNSCs) in the pars intercerebralis (PI) region of the brain; these cells also express and secrete Drosophila insulin like peptides (dILPs). Previously, we found that flies lacking SLOB exhibit increased resistance to starvation, and we reasoned that SLOB may regulate aspects of insulin signaling and metabolism. Here we investigate the role of SLOB in metabolism and find that slob null flies exhibit changes in energy storage and insulin pathway signaling. In addition, slob null flies have decreased levels of dilp3 and increased levels of takeout, a gene known to be involved in feeding and metabolism. Targeted expression of SLOB to mNSCs rescues these alterations in gene expression, as well as the metabolic phenotypes. Analysis of fly lines mutant for both slob and slo indicate that the effect of SLOB on metabolism and gene expression is via SLO. We propose that modulation of SLO by SLOB regulates neurotransmission in mNSCs, influencing downstream insulin pathway signaling and metabolism.


Conflict of interest statement

Competing Interests: The authors have declared that no competing interests exist.

Figures

Figure 1
Figure 1. to mRNA levels are increased in slobIP1 fly heads but still cycle.
A, Western blot demonstrating rescue of SLOB expression in fly heads using two separate drivers for mNSCs in the slobIP1 background. B , C , to mRNA levels in fly heads were measured by qPCR. to relative transcript levels are increased in slobIP1 flies and rescued by targeted expression of slob in mNSCs. D , to transcript levels cycle in WTP41 and slobIP1 fly heads. Zeitgeber time (ZT) is plotted on the X axis; the white and black bars represent “lights on” and “lights off”, respectively. Each graph is a summary of a minimum of three independent experiments (mean ± SEM). For comparisons between fly lines, * indicates p<0.05, ** indicates p<0.01, *** indicates p<0.001; for comparisons between ZT points within one fly line, ## indicates p<0.01, One-way ANOVA with Bonferroni post-test.
Figure 2
Figure 2. TO protein levels are increased in slobIP1 fly heads but still cycle.
TO protein levels in fly heads were measured by Western blot analysis and normalized to MAPK levels. A , Representative Western blot showing an increase in TO expression in slobIP1 fly heads compared to WTP41 fly heads. TO levels are rescued in slobIP1,mai301>slob fly heads. The graph is a summary of four independent experiments (mean ± SEM). * indicates p<0.05, One-way ANOVA with Bonferroni post-test. B , Representative Western blot showing that TO levels cycle in slobIP1 fly heads. Zeitgeber time (ZT) is plotted on the X axis; the white and black bars represent “lights on” and “lights off”, respectively. The graph is a summary of three independent experiments (mean ± SEM).
Figure 3
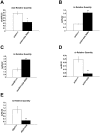
Figure 3. to mRNA levels are dependent on expression of SLOB.
Slob and to levels in fly heads were measured by qPCR. A , Relative slob transcript levels are decreased in heads of flies in which SLOB expression was knocked down ubiquitously using RNAi. B, Relative to transcript levels are increased in heads of flies in which SLOB expression was knocked down ubiquitously using RNAi. C , Relative to transcript levels are increased in heads of flies in which SLOB expression was knocked down in mNSCs using RNAi. D , Relative to transcript levels are decreased in heads of flies in which there is ubiquitous overexpression of SLOB. E , Relative to transcript levels are decreased in heads of flies in which SLOB was overexpressed exclusively in mNSCs. Each graph is a summary of a minimum of three independent experiments (mean ± SEM). * indicates p<0.05, ** indicates p<0.01, Student's t-test.
Figure 4
Figure 4. TO protein levels are dependent on expression of SLOB.
TO protein levels in fly heads were measured by Western blot analysis and normalized to MAPK levels. A , Representative Western blot showing increased TO in heads of flies in which SLOB expression was knocked down ubiquitously using RNAi. The graph is a summary of five independent experiments (mean ± SEM). B , Representative Western blot showing increased TO in heads of flies in which SLOB expression was knocked down in mNSCs using RNAi. The graph is a summary of six independent experiments (mean ± SEM). * indicates p<0.05, One-way ANOVA with Bonferroni post-test.
Figure 5
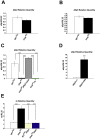
Figure 5. Effect of SLOB on expression of dilps.
Relative dilp2, -3, and -5 transcript levels in fly heads were measured by qPCR. A, B , Relative dilp2 or dilp5 transcript levels are unchanged in slobIP1 fly heads. C , Relative dilp3 transcript levels are reduced in slobIP1 fly heads and rescued by expression of SLOB in mNSCs, but not by mutation of to. D, Relative dilp3 transcript levels are increased in heads of flies overexpressing SLOB in mNSCs. E, The increase in to levels is abolished in slobIP1,dilp3 fly heads. Each graph is a summary of a minimum of three independent experiments (mean ± SEM). *** indicates p<0.001, One-way ANOVA with Bonferroni post-test (C, E) or Student's t-test (D).
Figure 6
Figure 6. slobIP1 flies exhibit alterations in energy metabolism and insulin pathway signaling.
A , Hemolymph was extracted from flies after fasting, and circulating trehalose and glucose were measured. SlobIP1 flies display significantly decreased levels of circulating trehalose plus glucose in hemolymph. Results are a summary of a minimum of five independent experiments (mean ± SEM). ** indicates p<0.01, Student's t-test. B , P-AKT levels were measured by Western blot and normalized to MAPK. Representative Western blot showing an increase in P-AKT in slobIP1 fly heads compared to WTP41 fly heads. The graph is a summary of eight independent experiments (mean ± SEM). * indicates p<0.05, One sample t-test. C , Whole body trehalose plus glucose levels were measured in flies after fasting. Stored trehalose plus glucose is decreased in slobIP1 flies and rescued by expression of SLOB in mNSCs. D , Whole body trehalose plus glucose levels are restored in fly lines with decreased levels of to compared to slobIP1 flies, including dilp3 fly lines. Each stored trehalose graph is a summary of a minimum of six samples (mean ± SEM). * indicates p<0.05, *** indicates p<0.001, One-way ANOVA with Bonferroni post-test. E , Whole body lipid levels were measured and normalized to protein levels. SlobIP1 flies display increased storage of triglycerides compared to WTP41 flies, and this effect is rescued by expression of SLOB in mNSCs or by mutation of to in the slobIP1 background. Results are presented as a summary of a minimum of nine samples (mean ± SEM). * indicates p<0.05, ** indicates p<0.01, One-way ANOVA with Bonferroni post-test.
Figure 7
Figure 7. The effects of SLOB on gene expression and metabolism require SLO.
A, Relative to transcript levels in fly heads were measured by qPCR. WTP41,slo1 and slobIP1,slo1 express equivalent amount of to in fly heads. B, Whole body trehalose plus glucose levels were measured in flies after fasting. Stored trehalose plus glucose levels are significantly decreased in slobIP1 flies compared to WTP41,slo1 or slobIP1,slo1 flies. C, The reduction in dilp3 levels is attenuated in slobIP1,slo1 fly heads. Results are a summary of a minimum of three (A, C) or 13 samples (B) (mean ± SEM). * indicates p<0.05, ** indicates p<0.01, *** indicates p<0.001, One-way ANOVA with Bonferroni post-test.
Figure 8
Figure 8. Proposed function of SLOB in mNSCs.
SLOB, through inhibitory modulation of SLO, influences dILP release from mNSCs and gene expression of to and dilp3. Slob null flies have elevated SLO activity, resulting in opposite effects on IIS and gene expression. Arrows denote positive regulation, while blunted lines denote negative regulation. Dotted lines denote relationships that are still unclear. See text for further details.

Similar articles

Cited by

References

    1. Atkinson NS, Robertson GA, Ganetzky B. A component of calcium-activated potassium channels encoded by the Drosophila slo locus. Science. 1991;253:551–555. - PubMed
    1. Elkins T, Ganetzky B, Wu CF. A Drosophila mutation that eliminates a calcium-dependent potassium current. Proc Natl Acad Sci U S A. 1986;83:8415–8419. - PMC - PubMed
    1. Wang J, Zhou Y, Wen H, Levitan IB. Simultaneous binding of two protein kinases to a calcium-dependent potassium channel. J Neurosci. 1999;19:RC4. - PMC - PubMed
    1. Zhou Y, Wang J, Wen H, Kucherovsky O, Levitan IB. Modulation of Drosophila slowpoke calcium-dependent potassium channel activity by bound protein kinase a catalytic subunit. J Neurosci. 2002;22:3855–3863. - PMC - PubMed
    1. Schopperle WM, Holmqvist MH, Zhou Y, Wang J, Wang Z, et al. Slob, a novel protein that interacts with the Slowpoke calcium-dependent potassium channel. Neuron. 1998;20:565–573. - PubMed

Publication types

MeSH terms