. 2012 Mar;17(2):157-63.
doi: 10.1007/s12199-011-0231-0. Epub 2011 Aug 18.

Age-related effects of fasting on ketone body production during lipolysis in rats

Affiliations

Age-related effects of fasting on ketone body production during lipolysis in rats

Yuriko Higashino-Matsui et al. Environ Health Prev Med. 2012 Mar.

Abstract

Objective: The age-related effects of fasting on lipolysis, the production of ketone bodies, and plasma insulin levels were studied in male 3-, 8-, and 32-week-old Sprague-Dawley rats.

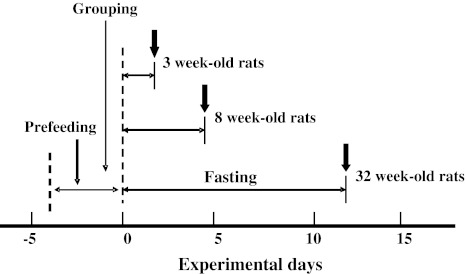
Methods: The rats were divided into fasting and control groups. The 3-, 8- and 32-week-old rats tolerated fasting for 2, 5, and 12 days, respectively.

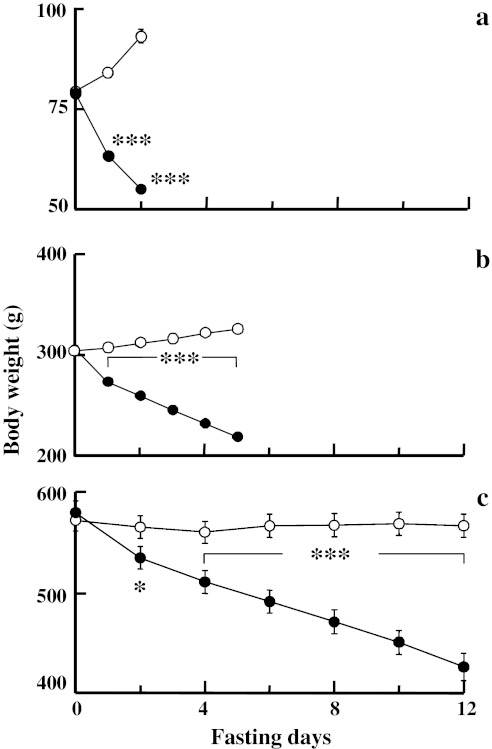
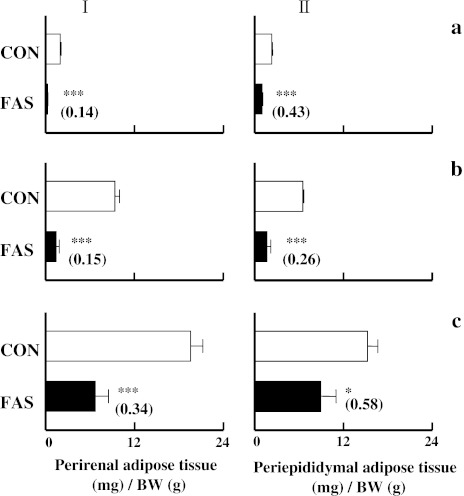
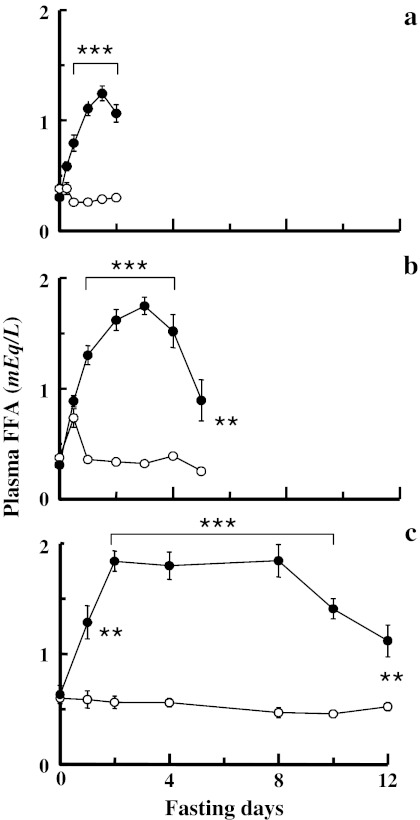
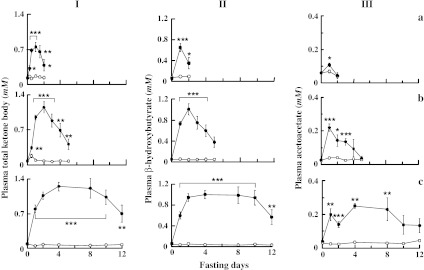
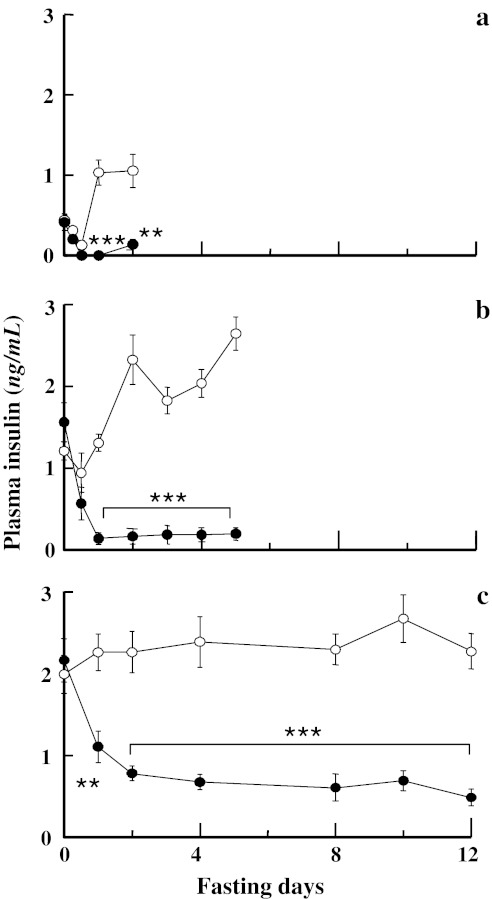
Results: Fasting markedly reduced the weights of perirenal and periepididymal white adipose tissues in rats in the three age groups. The mean rates of reduction in both these adipose tissue weights during fasting periods were higher in the order of 3 > 8 > 32-week-old rats. Fasting transiently increased plasma free fatty acid (FFA), total ketone body, β-hydroxybutyrate, and acetoacetate concentrations in the rats in the three age groups. However, plasma FFA, total ketone body, β-hydroxybutyrate, and acetoacetate concentrations in the 3-week-old rats reached maximal peak within 2 days after the onset of fasting, although these concentrations in the 8- and 32-week-old rats took more than 2 days to reach the maximal peak. By contrast, the augmentation of plasma FFA, total ketone body, β-hydroxybutyrate, and acetoacetate concentrations in the rats in the three age groups had declined at the end of each experimental period. Thus, the capacity for fat mobilization was associated with tolerance to fasting. Plasma insulin concentrations in the rats in the three age groups were dramatically reduced during fasting periods, although basal levels of insulin were higher in the order of 32 > 8 > 3 week-old rats.

Conclusion: These results suggest that differences in fat metabolism patterns among rats in the three age groups during prolonged fasting were partly reflected the metabolic turnover rates, plasma insulin levels, and amounts of fat storage.


Figures

Fig. 1
Fig. 1
Experimental protocol. Pre-feedings were carried out for 4 days. After the pre-feedings, rats in three age groups were divided into fasting (FAS) and control (CON) groups. Beginning on the next day, the 3-, 8-, and 32-week-old rats in the FAS group were deprived of food for 2, 5, and 12 days, respectively. During the experimental periods, body weights were measured. Plasma free fatty acid (FFA), total ketone body, β-hydroxybutyrate, and insulin concentrations were assayed. On the final days of fasting, the perirenal and periepididymal white adipose tissues were isolated and weighed (downwardarrows)
Fig. 2
Fig. 2
Effects of fasting on the body weights of a 3-, b 8-, and c 32-week-old rats. The values are shown as means ± SEM. Open circles CON groups (n = 8) and closed circles FAS groups (n = 8–9). Statistics: *p < 0.05 and ***p < 0.001 (vs. CON groups)
Fig. 3
Fig. 3
Effects of fasting on the weights of perirenal (I) and periepididymal (II) white adipose tissues in a 3-, b 8-, and c 32-week-old rats. The values are shown as means ± SEM. Open bars CON groups (n = 8) and closed bars FAS groups (n = 8–9). Values in parentheses are relative ratios of the FAS groups to the CON groups. Statistics: *p < 0.05 and ***p < 0.001 (vs. CON groups). BW body weight
Fig. 4
Fig. 4
Effects of fasting on plasma FFA concentrations in a 3-, b 8-, and c 32-week-old rats. The values are shown as means ± SEM. Open circles CON groups (n = 8) and closed circles FAS groups (n = 8–9). Statistics: **p < 0.01 and ***p < 0.001 (vs. CON groups)
Fig. 5
Fig. 5
Effects of fasting on plasma total ketone body (I), β-hydroxybutyrate (II), and acetoacetate (III) concentrations in a 3-, b 8-, and c 32-week-old rats. The values are shown as means ± SEM. Open circles CON groups (n = 8) and closed circles FAS groups (n = 8–9). Statistics: *p < 0.05, **p < 0.01 and ***p < 0.001 (vs. CON groups)
Fig. 6
Fig. 6
Effects of fasting on plasma insulin concentrations in a 3-, b 8-, and c 32-week-old rats. The values are shown as means ± SEM. Open circles CON groups (n = 8) and closed circles FAS groups (n = 8–9). Statistics: **p < 0.01 and ***p < 0.001 (vs. CON groups)

Similar articles

Cited by

References

    1. Garber AJ, Menzel PH, Boden G, Owen OE. Hepatic ketogenesis and gluconeogenesis in humans. J Clin Invest. 1974;54:981–989. doi: 10.1172/JCI107839. - DOI - PMC - PubMed
    1. Williamson DH, Whitelaw E. Physiological aspects of the regulation of ketogenesis. Biochem Soc Symp. 1978;43:137–161. - PubMed
    1. Beylot M. Regulation of in vivo ketogenesis: role of free fatty acids and control by epinephrine, thyroid hormones, insulin and glucagons. Diabetes Metab. 1996;22:299–304. - PubMed
    1. Kalderon B, Mayorek N, Berry E, Zevit N, Bar-Tana J. Fatty acid cycling in the fasting rat. Am J Physiol Endocrinol Metab. 2000;279:E221–E227. - PubMed
    1. Fukao T, Lopaschuk GD, Mitchell GA. Pathways and control of ketone body metabolism: on the fringe of lipid biochemistry. Prostaglandins Leukot Essent Fatty Acids. 2004;70:243–251. doi: 10.1016/j.plefa.2003.11.001. - DOI - PubMed

Publication types