

Computed tomography liver volumetry using 3-dimensional image data in living donor liver transplantation: effects of the slice thickness on the volume calculation
- PMID: 21850689
- PMCID: PMC3226887
- DOI: 10.1002/lt.22419
Computed tomography liver volumetry using 3-dimensional image data in living donor liver transplantation: effects of the slice thickness on the volume calculation
Abstract
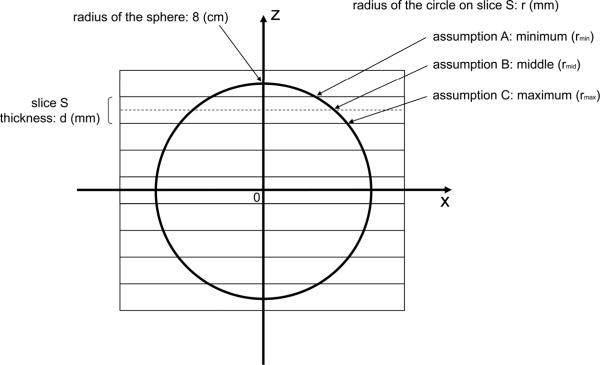
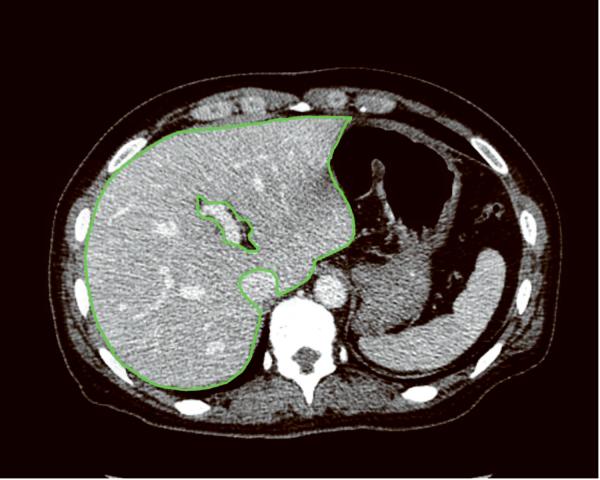
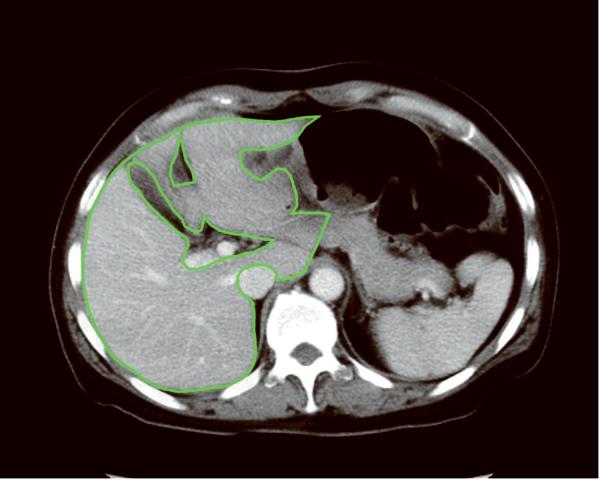
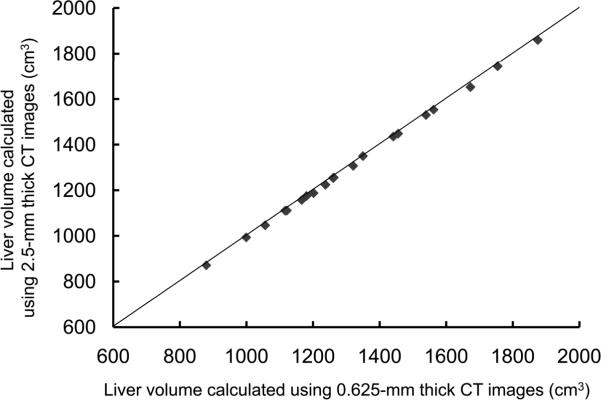
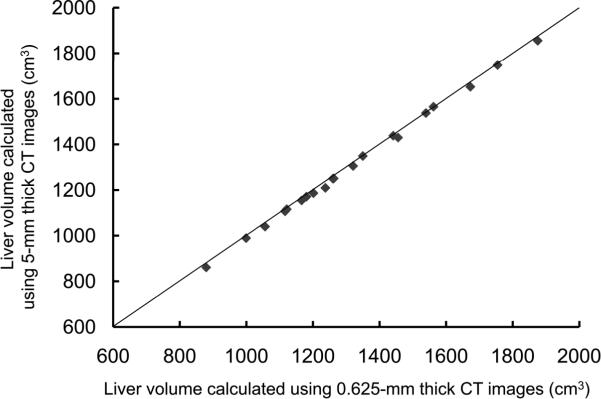
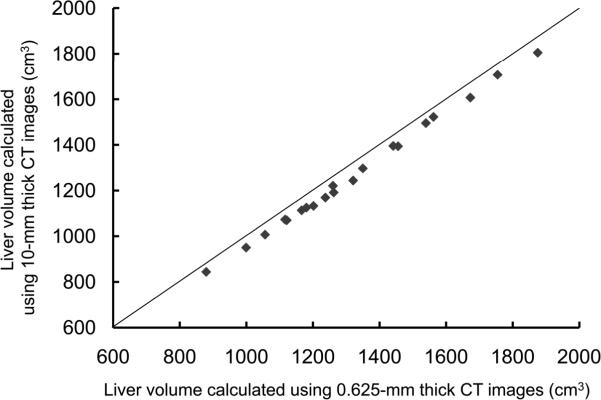
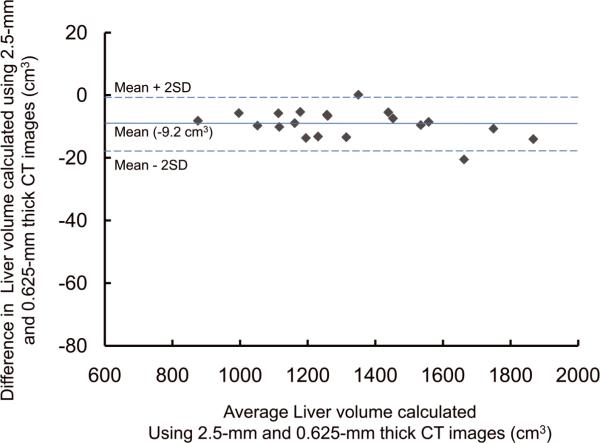
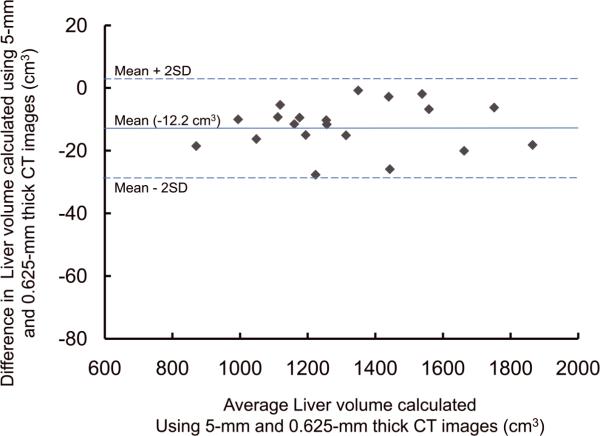
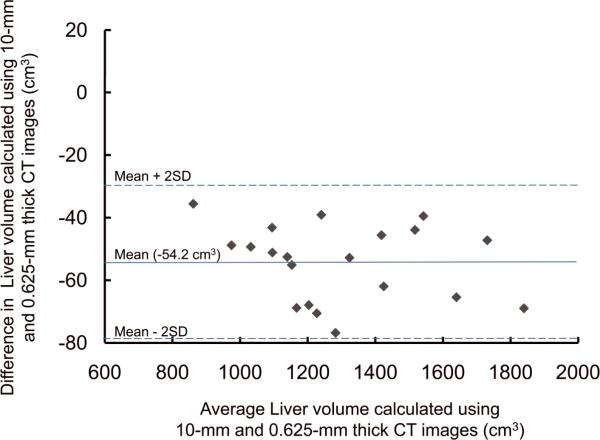
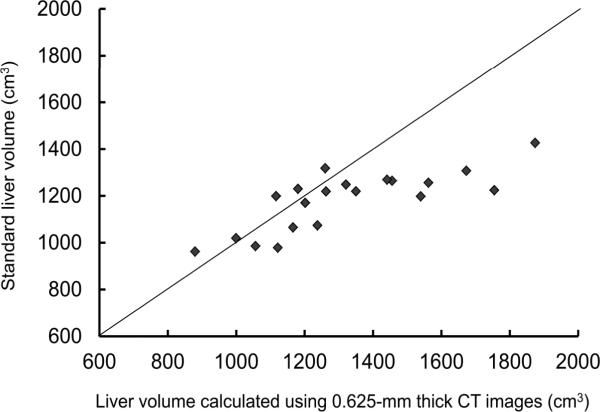
The purpose of this study was to evaluate the relationship between the slice thickness and the calculated volume in computed tomography (CT) liver volumetry through the comparison of the results from images [including 3-dimensional (3D) images] with various slice thicknesses. Twenty potential adult liver donors (12 men and 8 women) with a mean age of 39 years (range = 24-64 years) underwent CT with a 64-section multidetector row CT scanner after the intravenous injection of a contrast material. Four image sets with slice thicknesses of 0.625, 2.5, 5, and 10 mm were used. First, a program developed in our laboratory for automated liver extraction was applied to the CT images, and the liver boundaries were determined automatically. Then, an abdominal radiologist reviewed all images onto which automatically extracted boundaries had been superimposed and then edited the boundaries on each slice to enhance the accuracy. The liver volumes were determined via the counting of the voxels within the liver boundaries. The mean whole liver volumes estimated with CT were 1322.5 cm(3) from 0.625-mm images, 1313.3 cm(3) from 2.5-mm images, 1310.3 cm(3) from 5-mm images, and 1268.2 cm(3) from 10-mm images. The volumes calculated from 3D (0.625-mm) images were significantly larger than the volumes calculated from thicker images (P < 0.001). The partial liver volumes of right lobes, left lobes, and lateral segments were evaluated in a similar manner. The estimated maximum difference in the calculated volumes of lateral segments was -10.9 cm(3) (-4.63%) between 0.625- and 5-mm images. In conclusion, liver volumes calculated from 2.5-mm-thick or thicker images are significantly smaller than liver volumes calculated from 3D images. If a maximum error of 5% in the calculated graft volume will not have a significant clinical impact, 5-mm-thick images are acceptable for CT volumetry. If the impact is significant, 3D images could be essential.
Copyright © 2011 American Association for the Study of Liver Diseases.
Figures
Similar articles
-
Preoperative liver volumetry: how does the slice thickness influence the multidetector computed tomography- and magnetic resonance-liver volume measurements?J Comput Assist Tomogr. 2009 May-Jun;33(3):390-7. doi: 10.1097/RCT.0b013e3181806c29. J Comput Assist Tomogr. 2009. PMID: 19478632
-
Computed tomography liver volumetry in living donor liver transplantation: influence of the slice thickness on the volume calculation.J Pak Med Assoc. 2025 Apr;75(4):564-568. doi: 10.47391/JPMA.11539. J Pak Med Assoc. 2025. PMID: 40269363
-
Quantitative radiology: automated CT liver volumetry compared with interactive volumetry and manual volumetry.AJR Am J Roentgenol. 2011 Oct;197(4):W706-12. doi: 10.2214/AJR.10.5958. AJR Am J Roentgenol. 2011. PMID: 21940543 Free PMC article.
-
Right lobe estimated blood-free weight for living donor liver transplantation: accuracy of automated blood-free CT volumetry--preliminary results.Radiology. 2010 Aug;256(2):433-40. doi: 10.1148/radiol.10091897. Epub 2010 Jun 15. Radiology. 2010. PMID: 20551185
-
Multidetector CT in the evaluation of potential living donors for liver transplantation.Radiographics. 2005 Jul-Aug;25(4):1017-30. doi: 10.1148/rg.254045032. Radiographics. 2005. PMID: 16009821 Review.
Cited by
-
Pilot Study: The Effects of Slice Parameters and the Interobserver Measurement Variability in Computed Tomographic Hepatic Volumetry in Dogs without Hepatic Disease.Vet Sci. 2023 Feb 22;10(3):177. doi: 10.3390/vetsci10030177. Vet Sci. 2023. PMID: 36977216 Free PMC article.
-
Semi-automated computed tomography Volumetry can predict hemihepatectomy specimens' volumes in patients with hepatic malignancy.BMC Med Imaging. 2019 Feb 26;19(1):20. doi: 10.1186/s12880-019-0309-5. BMC Med Imaging. 2019. PMID: 30808320 Free PMC article.
-
Comparing fully automated AI body composition measures derived from thin and thick slice CT image data.Abdom Radiol (NY). 2024 Mar;49(3):985-996. doi: 10.1007/s00261-023-04135-1. Epub 2023 Dec 29. Abdom Radiol (NY). 2024. PMID: 38158424
-
Computed tomography-based measurements of normative liver and spleen volumes in children.Pediatr Radiol. 2023 Mar;53(3):378-386. doi: 10.1007/s00247-022-05551-z. Epub 2022 Dec 6. Pediatr Radiol. 2023. PMID: 36471169
-
A Cloud-Based System for Automated AI Image Analysis and Reporting.J Imaging Inform Med. 2025 Feb;38(1):368-379. doi: 10.1007/s10278-024-01200-z. Epub 2024 Jul 31. J Imaging Inform Med. 2025. PMID: 39085717 Free PMC article.
References
-
- Heymsfield SB, Fulenwider T, Nordlinger B, Barlow R, Sones P, Kutner M. Accurate measurement of liver, kidney, and spleen volume and mass by computerized axial tomography. Ann Intern Med. 1979;90:185–187. - PubMed
-
- Kawasaki S, Makuuchi M, Matsunami H, Hashikura Y, Ikegami T, Chisuwa H, et al. Preoperative measurement of segmental liver volume of donors for living related liver transplantation. Hepatology. 1993;18:1115–1120. - PubMed
-
- Wang F, Pan KT, Chu SY, Chan KM, Chou HS, Wu TJ, Lee WC. Preoperative estimation of the liver graft weight in adult right lobe living donor liver transplantation using maximal portal vein diameters. Liver Transpl. 2011;17:373–380. - PubMed
-
- Soejima Y, Shimada M, Suehiro T, Hiroshige S, Ninomiya M, Shiotani S, et al. Outcome analysis in adult-to-adult living donor liver transplantation using the left lobe. Liver Transpl. 2003;9:581–586. - PubMed
-
- Taner CB, Dayangac M, Akin B, Balci D, Uraz S, Duran C, et al. Donor safety and remnant liver volume in living donor liver transplantation. Liver Transpl. 2008;14:1174–1179. - PubMed