

Non-additive hepatic gene expression elicited by 2,3,7,8-tetrachlorodibenzo-p-dioxin (TCDD) and 2,2',4,4',5,5'-hexachlorobiphenyl (PCB153) co-treatment in C57BL/6 mice
- PMID: 21851831
- PMCID: PMC4126514
- DOI: 10.1016/j.taap.2011.08.002
Non-additive hepatic gene expression elicited by 2,3,7,8-tetrachlorodibenzo-p-dioxin (TCDD) and 2,2',4,4',5,5'-hexachlorobiphenyl (PCB153) co-treatment in C57BL/6 mice
Abstract
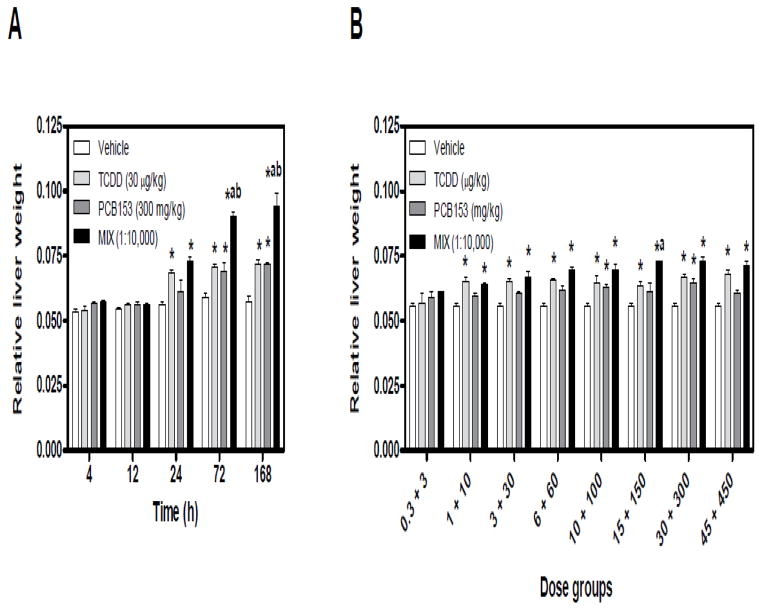
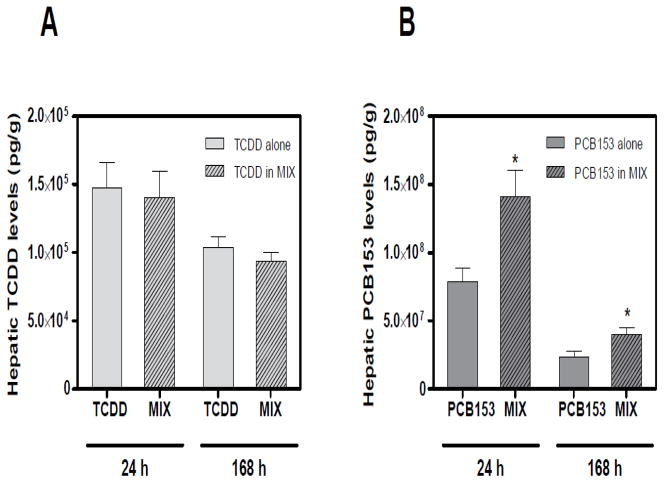
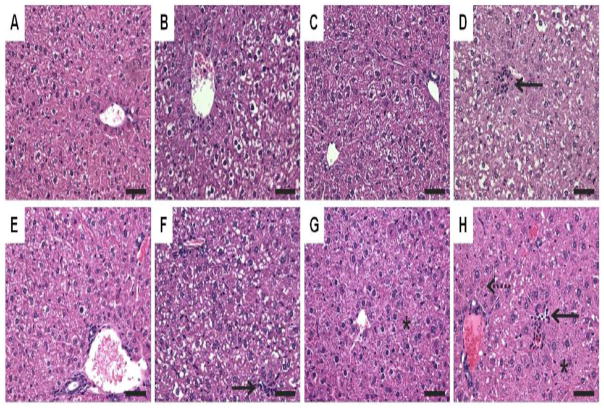
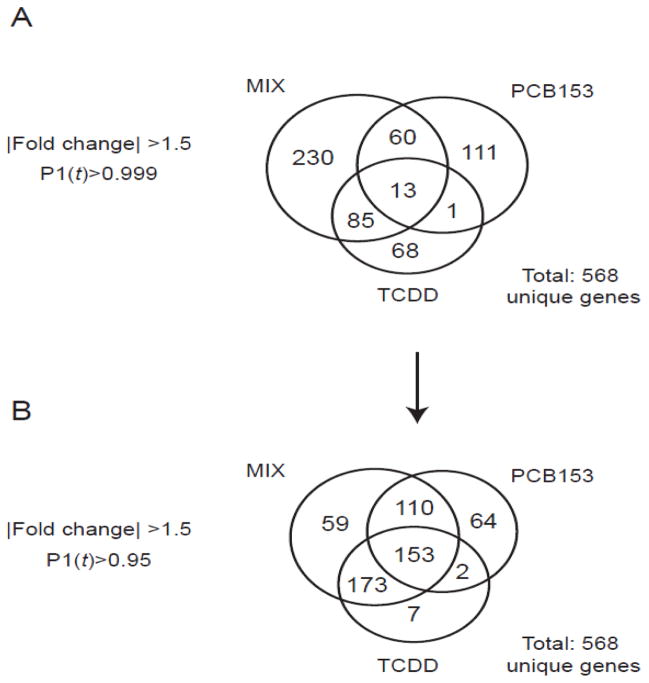
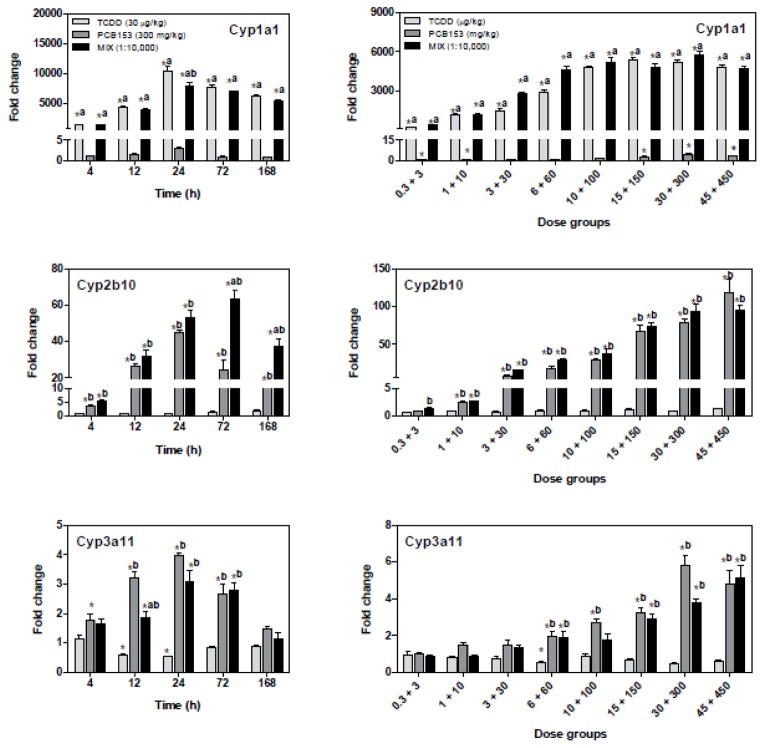
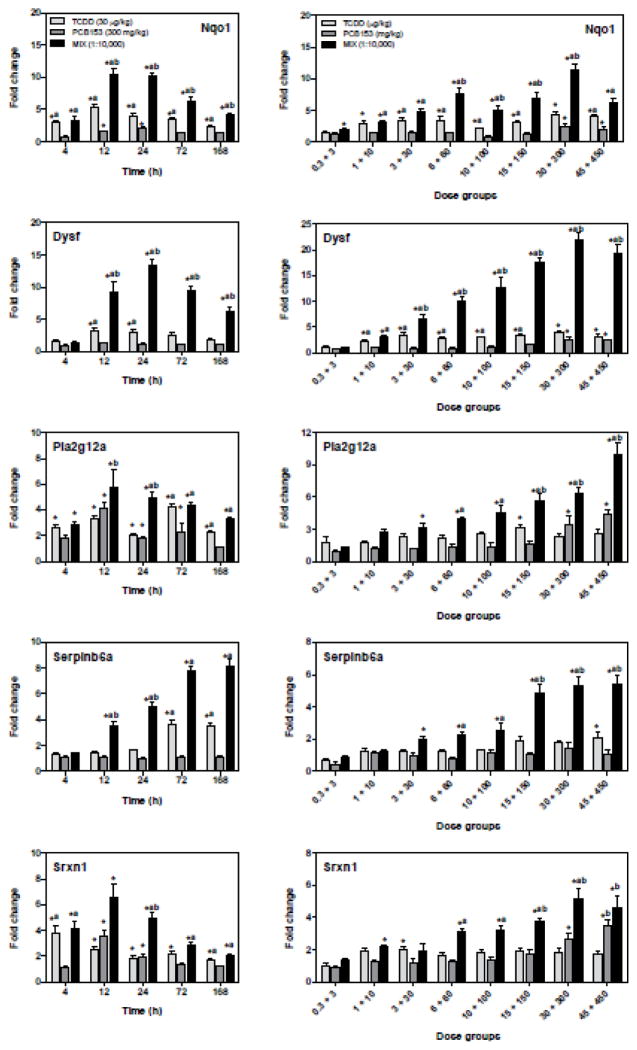
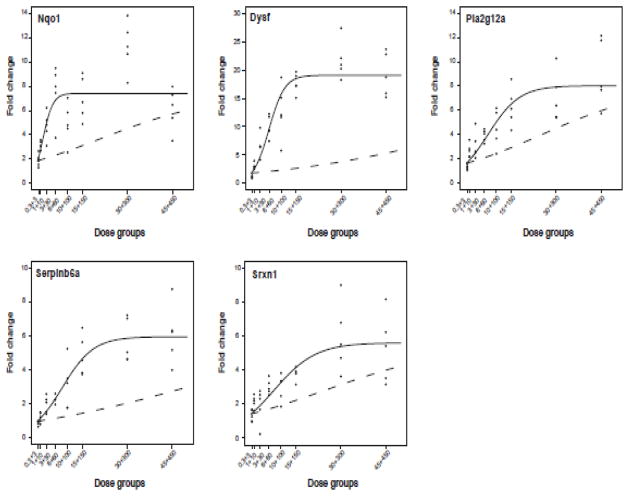
Interactions between environmental contaminants can lead to non-additive effects that may affect the toxicity and risk assessment of a mixture. Comprehensive time course and dose-response studies with 2,3,7,8-tetrachlorodibenzo-p-dioxin (TCDD), non-dioxin-like 2,2',4,4',5,5'-hexachlorobiphenyl (PCB153) and their mixture were performed in immature, ovariectomized C57BL/6 mice. Mice were gavaged once with 30 μg/kg TCDD, 300 mg/kg PCB153, a mixture of 30 μg/kg TCDD with 300 mg/kg PCB153 (MIX) or sesame oil vehicle for 4,12, 24,72 or 168 h. In the 24h dose-response study, animals were gavaged with TCDD (0.3,1, 3, 6, 10, 15, 30, 45 μg/kg), PCB153 (3,10, 30, 60, 100, 150, 300, 450 mg/kg), MIX (0.3+3, 1+10, 3+30, 6+60, 10+100, 15+150, 30+300, 45 μg/kg TCDD+450 mg/kg PCB153, respectively) or vehicle. All three treatments significantly increased relative liver weights (RLW), with MIX eliciting significantly greater increases compared to TCDD and PCB153 alone. Histologically, MIX induced hepatocellular hypertrophy, vacuolization, inflammation, hyperplasia and necrosis, a combination of TCDD and PCB153 responses. Complementary lipid analyses identified significant increases in hepatic triglycerides in MIX and TCDD samples, while PCB153 had no effect on lipids. Hepatic PCB153 levels were also significantly increased with TCDD co-treatment. Microarray analysis identified 167 TCDD, 185 PCB153 and 388 MIX unique differentially expressed genes. Statistical modeling of quantitative real-time PCR analysis of Pla2g12a, Serpinb6a, Nqo1, Srxn1, and Dysf verified non-additive expression following MIX treatment compared to TCDD and PCB153 alone. In summary, TCDD and PCB153 co-treatment elicited specific non-additive gene expression effects that are consistent with RLW increases, histopathology, and hepatic lipid accumulation.
Copyright © 2011 Elsevier Inc. All rights reserved.
Figures
Similar articles
-
PCB153-elicited hepatic responses in the immature, ovariectomized C57BL/6 mice: comparative toxicogenomic effects of dioxin and non-dioxin-like ligands.Toxicol Appl Pharmacol. 2010 Mar 15;243(3):359-71. doi: 10.1016/j.taap.2009.12.003. Epub 2009 Dec 18. Toxicol Appl Pharmacol. 2010. PMID: 20005886 Free PMC article.
-
Automated dose-response analysis and comparative toxicogenomic evaluation of the hepatic effects elicited by TCDD, TCDF, and PCB126 in C57BL/6 mice.Toxicol Sci. 2010 Nov;118(1):286-97. doi: 10.1093/toxsci/kfq236. Epub 2010 Aug 11. Toxicol Sci. 2010. PMID: 20702594 Free PMC article.
-
Comparative toxicogenomic examination of the hepatic effects of PCB126 and TCDD in immature, ovariectomized C57BL/6 mice.Toxicol Sci. 2008 Mar;102(1):61-75. doi: 10.1093/toxsci/kfm289. Epub 2007 Nov 27. Toxicol Sci. 2008. PMID: 18042819
-
Opposite effects of 2,2',4,4',5,5'-hexachlorobiphenyl and 2,3,7,8-tetrachlorodibenzo-p-dioxin on the antibody response to sheep erythrocytes in mice.Fundam Appl Toxicol. 1997 Jun;37(2):141-9. doi: 10.1006/faat.1997.2323. Fundam Appl Toxicol. 1997. PMID: 9242587
-
Toxicology and carcinogenesis studies of a mixture of 2,3,7,8-tetrachlorodibenzo-p-dioxin (TCDD) (Cas No. 1746-01-6), 2,3,4,7,8-pentachlorodibenzofuran (PeCDF) (Cas No. 57117-31-4), and 3,3',4,4',5-pentachlorobiphenyl (PCB 126) (Cas No. 57465-28-8) in female Harlan Sprague-Dawley rats (gavage studies).Natl Toxicol Program Tech Rep Ser. 2006 Sep;(526):1-180. Natl Toxicol Program Tech Rep Ser. 2006. PMID: 17342195
Cited by
-
Mechanism-Based Classification of PAH Mixtures to Predict Carcinogenic Potential.Toxicol Sci. 2015 Jul;146(1):135-45. doi: 10.1093/toxsci/kfv080. Epub 2015 Apr 22. Toxicol Sci. 2015. PMID: 25908611 Free PMC article.
-
A framework for the use of single-chemical transcriptomics data in predicting the hazards associated with complex mixtures of polycyclic aromatic hydrocarbons.Arch Toxicol. 2017 Jul;91(7):2599-2616. doi: 10.1007/s00204-016-1891-8. Epub 2016 Nov 17. Arch Toxicol. 2017. PMID: 27858113 Free PMC article.
-
The role of AHR-inducible cytochrome P450s in metabolism of polyunsaturated fatty acids.Drug Metab Rev. 2016 Aug;48(3):342-50. doi: 10.1080/03602532.2016.1197240. Epub 2016 Jun 30. Drug Metab Rev. 2016. PMID: 27358009 Free PMC article. Review.
-
Aryl hydrocarbon receptor-mediated induction of Stearoyl-CoA desaturase 1 alters hepatic fatty acid composition in TCDD-elicited steatosis.Toxicol Sci. 2011 Dec;124(2):299-310. doi: 10.1093/toxsci/kfr226. Epub 2011 Sep 2. Toxicol Sci. 2011. PMID: 21890736 Free PMC article.
-
Toxicant-associated steatohepatitis.Toxicol Pathol. 2013 Feb;41(2):343-60. doi: 10.1177/0192623312468517. Epub 2012 Dec 21. Toxicol Pathol. 2013. PMID: 23262638 Free PMC article. Review.
References
-
- Bannister R, Safe S. Synergistic interactions of 2,3,7,8-TCDD and 2,2′,4,4′,5,5′-hexachlorobiphenyl in C57BL/6J and DBA/2J mice: role of the Ah receptor. Toxicology. 1987;44:159–169. - PubMed
-
- Biegel L, Harris M, Davis D, Rosengren R, Safe L, Safe S. 2,2′,4,4′,5,5′-hexachlorobiphenyl as a 2,3,7,8-tetrachlorodibenzo-p-dioxin antagonist in C57BL/6J mice. Toxicol Appl Pharmacol. 1989;97:561–571. - PubMed
-
- Blumberg B, Evans RM. Orphan nuclear receptors--new ligands and new possibilities. Genes & development. 1998;12:3149–3155. - PubMed
-
- Boesze-Battaglia K, Schimmel R. Cell membrane lipid composition and distribution: implications for cell function and lessons learned from photoreceptors and platelets. J Exp Biol. 1997;200:2927–2936. - PubMed
-
- Borgert CJ. Predicting interactions from mechanistic information: can omic data validate theories? Toxicol Appl Pharmacol. 2007;223:114–120. - PubMed
Publication types
MeSH terms
Substances
Grants and funding
LinkOut - more resources
Full Text Sources
Miscellaneous
