

An economic analysis of community-level fast food prices and individual-level fast food intake: a longitudinal study
- PMID: 21852178
- PMCID: PMC3190083
- DOI: 10.1016/j.healthplace.2011.07.011
An economic analysis of community-level fast food prices and individual-level fast food intake: a longitudinal study
Abstract
Background: While dietary intake is shaped by cost, there is minimal research on the association between community-level food prices and dietary intake.
Methods: We used nationally representative, longitudinal data to examine how community-level food price variation was associated with individual-level fast food intake by race/ethnicity and income across waves II (1996) and III (2001-2002) of the National Longitudinal Study of Adolescent Health (n=11,088) from 158 baseline and 363 follow-up US counties.
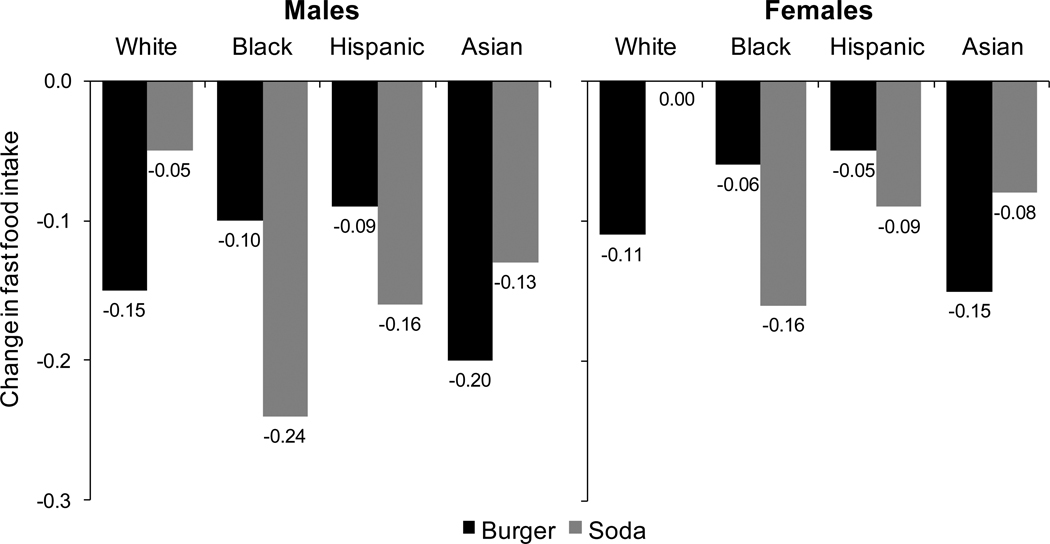
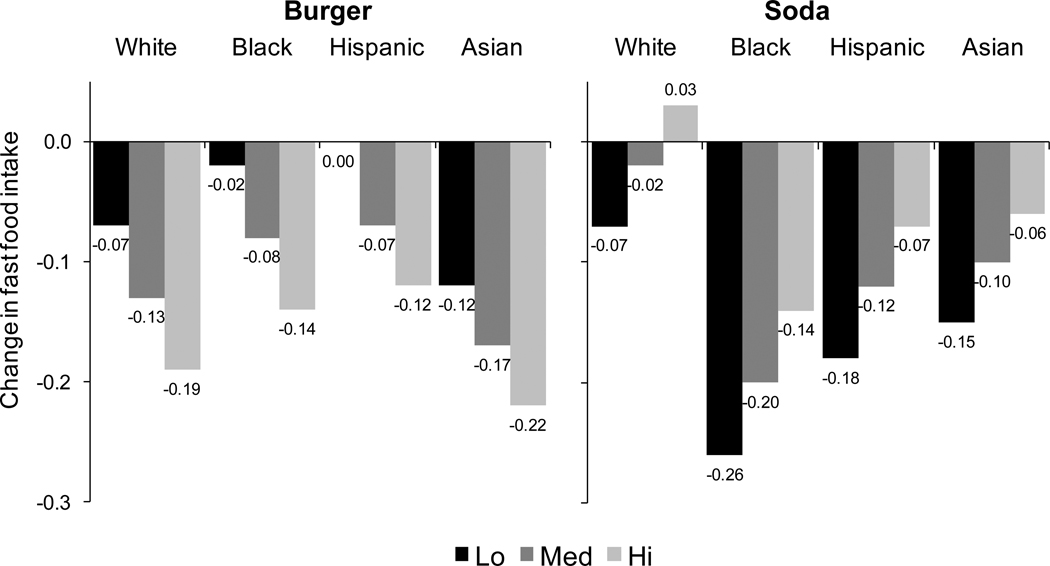
Results: Negative binomial regression models predicting the number of fast food meals per week show strong relationships between fast food consumption and prices of fast food and soda that varied by gender and race/ethnicity. We found relatively stronger association between food prices and fast food intake for males and relatively greater price sensitivity for soda versus burgers. In the group with strongest associations (black males), a 20% increase in the price of soda was associated with a decrease of 0.25 visits to a fast food restaurant per week.
Conclusions: Economic incentives may be an effective mechanism to address fast food intake in an age group at high risk for obesity.
Copyright © 2011 Elsevier Ltd. All rights reserved.
Figures
Similar articles
-
Sociodemographic differences in fast food price sensitivity.JAMA Intern Med. 2014 Mar;174(3):434-42. doi: 10.1001/jamainternmed.2013.13922. JAMA Intern Med. 2014. PMID: 24424384 Free PMC article.
-
Fast food price, diet behavior, and cardiometabolic health: Differential associations by neighborhood SES and neighborhood fast food restaurant availability in the CARDIA study.Health Place. 2015 Sep;35:128-35. doi: 10.1016/j.healthplace.2015.06.010. Epub 2015 Sep 15. Health Place. 2015. PMID: 26319447 Free PMC article.
-
Fast food costs and adolescent body mass index: evidence from panel data.J Health Econ. 2009 Sep;28(5):963-70. doi: 10.1016/j.jhealeco.2009.06.009. Epub 2009 Jun 21. J Health Econ. 2009. PMID: 19732982
-
Fast-food and full-service restaurant consumption among children and adolescents: effect on energy, beverage, and nutrient intake.JAMA Pediatr. 2013 Jan;167(1):14-20. doi: 10.1001/jamapediatrics.2013.417. JAMA Pediatr. 2013. PMID: 23128151 Free PMC article.
-
Environmental interventions to reduce the consumption of sugar-sweetened beverages and their effects on health.Cochrane Database Syst Rev. 2019 Jun 12;6(6):CD012292. doi: 10.1002/14651858.CD012292.pub2. Cochrane Database Syst Rev. 2019. PMID: 31194900 Free PMC article.
Cited by
-
Taxing junk food to counter obesity.Am J Public Health. 2013 Nov;103(11):1949-53. doi: 10.2105/AJPH.2013.301279. Epub 2013 Sep 12. Am J Public Health. 2013. PMID: 24028245 Free PMC article.
-
Food Away from Home and Childhood Obesity.Curr Obes Rep. 2014 Dec;3(4):459-69. doi: 10.1007/s13679-014-0121-z. Curr Obes Rep. 2014. PMID: 26626922
-
Does the local food environment around schools affect diet? Longitudinal associations in adolescents attending secondary schools in East London.BMC Public Health. 2013 Jan 24;13:70. doi: 10.1186/1471-2458-13-70. BMC Public Health. 2013. PMID: 23347757 Free PMC article.
-
Price, promotion, and availability of nutrition information: a descriptive study of a popular fast food chain in New York City.Glob J Health Sci. 2013 Aug 25;5(6):73-80. doi: 10.5539/gjhs.v5n6p73. Glob J Health Sci. 2013. PMID: 24171876 Free PMC article.
-
Do obesity-promoting food environments cluster around socially disadvantaged schools in Glasgow, Scotland?Health Place. 2012 Nov;18(6):1335-40. doi: 10.1016/j.healthplace.2012.06.001. Epub 2012 Jun 16. Health Place. 2012. PMID: 22819370 Free PMC article.
References
Publication types
MeSH terms
Grants and funding
LinkOut - more resources
Full Text Sources
