. 2011 Oct 14;286(41):35407-35417.
doi: 10.1074/jbc.M110.205708. Epub 2011 Aug 18.

Glutathione peroxidase-1 deficiency augments proinflammatory cytokine-induced redox signaling and human endothelial cell activation

Affiliations

Glutathione peroxidase-1 deficiency augments proinflammatory cytokine-induced redox signaling and human endothelial cell activation

Edith Lubos et al. J Biol Chem. .

Abstract

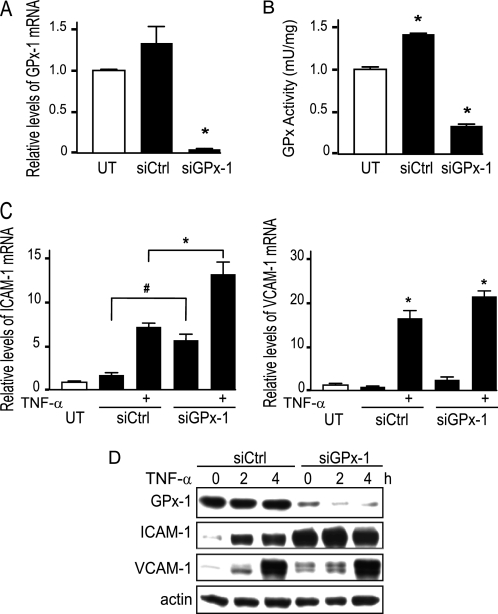
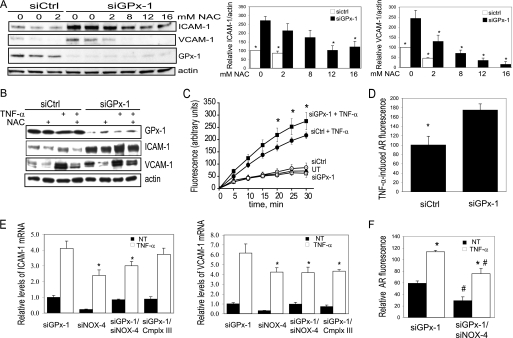
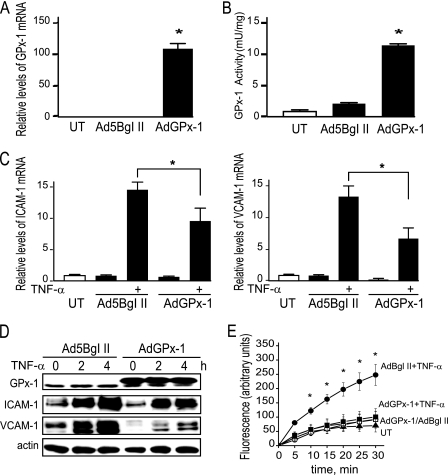
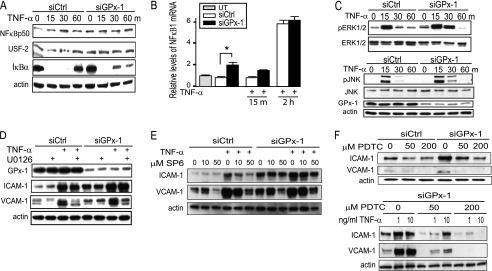
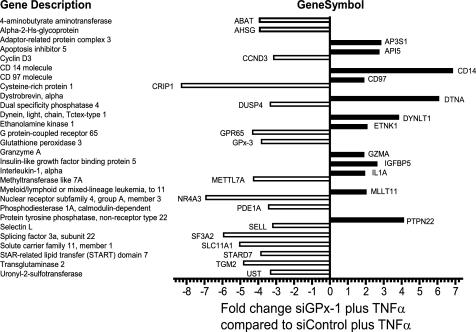
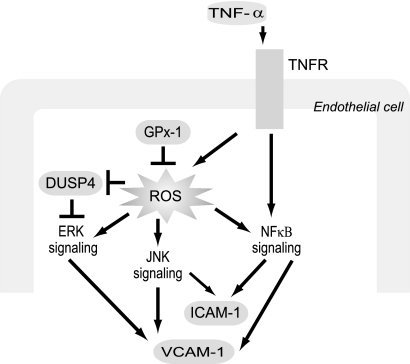
Glutathione peroxidase-1 (GPx-1) is a crucial antioxidant enzyme, the deficiency of which promotes atherogenesis. Accordingly, we examined the mechanisms by which GPx-1 deficiency enhances endothelial cell activation and inflammation. In human microvascular endothelial cells, we found that GPx-1 deficiency augments intercellular adhesion molecule-1 (ICAM-1) and vascular cell adhesion molecule-1 (VCAM-1) expression by redox-dependent mechanisms that involve NFκB. Suppression of GPx-1 enhanced TNF-α-induced ROS production and ICAM-1 expression, whereas overexpression of GPx-1 attenuated these TNF-α-mediated responses. GPx-1 deficiency prolonged TNF-α-induced IκBα degradation and activation of ERK1/2 and JNK. JNK or NFκB inhibition attenuated TNF-α induction of ICAM-1 and VCAM-1 expression in GPx-1-deficient and control cells, whereas ERK1/2 inhibition attenuated only VCAM-1 expression. To analyze further signaling pathways involved in GPx-1-mediated protection from TNF-α-induced ROS, we performed microarray analysis of human microvascular endothelial cells treated with TNF-α in the presence and absence of GPx-1. Among the genes whose expression changed significantly, dual specificity phosphatase 4 (DUSP4), encoding an antagonist of MAPK signaling, was down-regulated by GPx-1 suppression. Targeted DUSP4 knockdown enhanced TNF-α-mediated ERK1/2 pathway activation and resulted in increased adhesion molecule expression, indicating that GPx-1 deficiency may augment TNF-α-mediated events, in part, by regulating DUSP4.


Figures

FIGURE 1.
FIGURE 1.
Knockdown of GPx-1 and TNF-α-induced ICAM-1 and VCAM-1 expression. A, HMVEC were transfected with siGPx-1 or siRNA control (siCtrl) for 48 h and mRNA was measured by qRT-PCR following normalization to GAPDH as endogenous control (n = 4) (p = 0.0003 by ANOVA) and compared with an untransfected sample to obtain relative mRNA levels. B, GPx-1 enzyme activity was determined by an indirect assay (n = 4) (p < 0.001 by ANOVA). UT indicates untransfected cells. Pairwise comparison is shown, *, p < 0.001 versus no treatment. C, transfected cells were treated with 20 ng/ml of TNF-α for 2 h and ICAM-1 and VCAM-1 mRNA were measured by qRT-PCR as in A (n = 5) (#, p < 0.01 and *, p < 0.0001 by Fisher's PLSD). ICAM-1 gene expression was significantly increased over no treatment by GPx-1 knockdown, in the presence or absence of TNF-α and by control transfection plus TNF-α. VCAM-1 gene expression was significantly elevated by TNF-α, compared with all non-TNF-α treated controls (*) and tended to be higher in siGPx-1 cells compared with controls. D, proteins (10 μg) were separated on 4–15% SDS-PAGE gels and transferred to HyBond membrane. Antibodies against GPx-1 (MBL, Woburn, MA), ICAM-1 and VCAM-1 (Santa Cruz Biochemicals), and actin (Sigma) were used to detect the effect of 20 ng/ml of TNF-α in GPx-1-deficient compared with siControl cells for 2 and 4 h. Representative blots are shown.
FIGURE 2.
FIGURE 2.
Knockdown of GPx-1 and ROS-mediated effects. A, HMVEC were treated with 0–16 mm NAC immediately following transfection with siGPx-1 or siRNA control (siCtrl). Proteins (10 μg) were harvested 48 h later, separated on 4–15% SDS-PAGE gels, and transferred to HyBond membrane. Western blot was used to detect ICAM-1, VCAM-1, GPx-1, and actin. Plots to the right indicate relative expression of ICAM-1 and VCAM-1 normalized to actin (n = 3). The effects of NAC on ICAM-1 or VCAM-1 were significant by ANOVA (p < 0.005); *, indicates significant pairwise differences with siGPx-1 in the absence of NAC, by post hoc analysis (p < 0.05). B, 48 h after transfection, cells were pretreated 1 h with the antioxidant, NAC, before TNF-α exposure (20 ng/ml). ICAM-1 and VCAM-1 expression was determined by immunoblotting 4 h following TNF-α treatment (n = 4). Representative blots are shown. C, reactive oxygen species accumulation was measured by DCF fluorescence with an excitation wavelength of 485 nm and recording emission at 518 nm. An average of seven experiments with mean ± S.E. is shown (p < 0.0001 by ANOVA and *, p < 0.05 by Fisher's PLSD). Boxes indicate cells treated with siGPx-1, circles indicate cells treated with siControl (siCtrl), filled triangles indicate untransfected (UT) cells, and filled circles and squares represent transfected cells additionally treated with TNF-α. D, relative hydrogen peroxide in media from siGPx-1- and siControl-treated cells was measured 48 h following transfection by monitoring TNF-α-induced Amplex Red (AR) fluorescence in the presence of horseradish peroxidase (excitation 530 nm and emission 590 nm). In the presence of catalase, no AR fluorescence was detected. Fluorescence values are normalized for protein. *, indicates significant differences by t test (p < 0.04, n = 7). E, relative levels of ICAM-1 and VCAM-1 mRNA were measured by qRT-PCR 48 h following transfection with siRNAs; values have been normalized to actin. Values were analyzed by ANOVA followed by pairwise comparisons (p < 0.05 significance). *, significantly different from siGPx-1 treated with TNF-α. All TNF-α values are significantly higher than the no TNF-α (NT) values. F, relative AR fluorescence was measured as in D from cells transfected with siGPx-1 or siGPx-1 together with siNOX-4. The absence of NOX-4 significantly decreased AR fluorescence in the presence or absence of TNF-α. Values were analyzed as in E. *, significantly different from corresponding no TNF-α; #, significantly different from the corresponding siGPx-1 NT or siGPx-1 TNF-α (n = 7).
FIGURE 3.
FIGURE 3.
Overexpression of GPx-1 and TNF-α-induced ICAM-1 and VCAM-1 expression and ROS accumulation. A, adenovirus treatment for 48 h enhances GPx-1 expression (AdGPx-1) compared with empty vector control (Ad5Bgl II). mRNA was measured by qRT-PCR (n = 5) using GAPDH as an endogenous control, and compared with untransduced cells to obtain relative mRNA levels. B, GPx-1 enzyme activity was measured by an indirect assay (n = 4). Means were significantly different by ANOVA (p < 0.0001), and post hoc comparison found (*) p < 0.00001 compared with no treatment. C, adenovirus treatment of cells to enhance GPx-1 expression resulted in decreased ICAM-1 and VCAM-1 mRNA, relative values of mRNA were calculated as in A. Values were analyzed by ANOVA followed by pairwise comparison, which showed significant differences between empty vector control and GPx-1 overexpressing cells (n = 4–5, *, p < 0.05). Data are presented as mean ± S.E. D, protein expression after 20 ng/ml of TNF-α treatment for 2–4 h in adenovirus-treated cells. Representative blots are shown. Note that the c-Myc-tagged recombinant GPx-1 in the AdGPx-1 lanes migrates more slowly than the endogenous GPx-1. E, DCF fluorescence was measured after cells were treated with adenovirus for 48 h and grown in 96-well plates to near confluence. Prior to treatment with 20 ng/ml of TNF-α, cells were loaded with 6-carboxy-2′,7′-dichlorodihydrofluorescein diacetate ester (n = 5) (*, p < 0.05 by Fisher's PLSD). Circles indicate cells treated with control adenovirus (AdBglII), squares represent cells treated with AdGPx-1, and filled circles and squares represent adenovirus-transformed cells additionally treated with TNF-α. Untreated, untransformed cells (UT) are represented by closed triangles.
FIGURE 4.
FIGURE 4.
Knockdown of GPx-1 and NFκB and MAPK signaling pathways in TNF-α-treated cells. A, to determine the effect of TNF-α on NFκB signaling in GPx-1-deficient and control cells by immunoblotting, nuclear extraction was used to detect NFκB p50 and USF-2 protein (a nuclear control) and the cytoplasmic fraction for IκBα and actin protein (cytoplasmic control) (n = 3). B, qRT-PCR was used to measure NFκB1 mRNA after 10 ng/ml of TNF-α for 15 min and 2 h in GPx-1-deficient and control cells. UT indicates untransfected cells. mRNA was measured by qRT-PCR following normalization to GAPDH as endogenous control and compared with an untransfected sample to obtain relative mRNA levels. Significant differences were observed between transfected cells analyzed by pairwise comparison with the Fisher's PLSD test (*, p < 0.05, n = 4). C and D, Western blot analysis: C, the effect of TNF-α on MAPK signaling was tested by analyzing phospho-ERK1/2 protein and phospho-JNK in GPx-1-deficient and control cells (n = 4). D, GPx-1-deficient and control cells were pretreated with MEK1/2 inhibitor (U0126) 1 h prior to TNF-α exposure at 10 ng/ml for 4 h. E, GPx-1-deficient and control cells were pretreated with a JNK inhibitor (SP600125) 1 h prior to TNF-α exposure. F, GPx-1-deficient and control cells were pretreated with PDTC, an NFκB inhibitor, immediately following transfection. Shown is the effect of PDTC on ICAM-1 and VCAM-1 in the absence or presence of TNF-α (1 ng or 10 ng/ml).
FIGURE 5.
FIGURE 5.
Genes differentially regulated by siGPx-1 deficiency. Genes were selected by leading edge analysis from the top 100 sets identified by Gene Set Enrichment Analysis. Supplemental Table S4 lists additional targets. Positive values indicate increased expression in GPx-1-deficient plus TNF-α-treated cells and negative values indicate increased expression in siControl plus TNF-α treatment.
FIGURE 6.
FIGURE 6.
GPx-1 and DUSP4 in TNF-α-treated cells. HMVEC were transfected with siDUSP4 or siRNA control (siCtrl) for 24 h. A, DUSP4 transcripts were measured by qRT-PCR (n = 5) following normalization to GAPDH as endogenous control (n = 4) and compared with an untransfected sample to obtain relative mRNA levels. Using ANOVA (p < 0.0001) and Fisher's PLSD post hoc testing (*, p < 0.05), significant differences were observed. B, siDUSP- and siControl-treated cells were treated with TNF-α and activation of ERK1/2 and JNK was analyzed by Western blot detection of their phosphorylated forms. C and D, the effect of TNF-α treatment on ICAM-1, and VCAM-1 mRNA (C) and protein (D) expression in DUSP4-deficient cells was compared with that in siCtrl cells as determined by qRT-PCR as described in A, and immunoblotting. E, the ability of DUSP4 to modify TNF-α-mediated ICAM-1 and VCAM-1 protein expression was tested in GPx-1-deficient and control transfected cells by using an adenovirus to DUSP4 or a control adenovirus (AdCtrl) and analyzing extracts by Western blot.
FIGURE 7.
FIGURE 7.
Proposed model illustrating a role for GPx-1 in TNF-α activation of endothelial cells. In response to extracellular (TNF-α) and intracellular (GPx-1 deficiency) oxidative stress, NFκB is activated, increasing ICAM-1 and VCAM-1 expression. In addition, GPx-1 deficiency plus TNF-α treatment augments phospho-ERK1/2 and JNK activation, in part, by decreasing the expression of the gene encoding DUSP4, a MAPK phosphatase. ERK1/2 pathways contribute to VCAM-1 expression and other TNF-α-mediated effects that are not shown.

Similar articles

Cited by

References

    1. Raes M., Michiels C., Remacle J. (1987) Free Radic. Biol. Med. 3, 3–7 - PubMed
    1. Ursini F., Maiorino M., Brigelius-Flohé R., Aumann K. D., Roveri A., Schomburg D., Flohé L. (1995) Methods Enzymol. 252, 38–53 - PubMed
    1. Brigelius-Flohé R. (1999) Free Radic. Biol. Med. 27, 951–965 - PubMed
    1. de Haan J. B., Bladier C., Griffiths P., Kelner M., O'Shea R. D., Cheung N. S., Bronson R. T., Silvestro M. J., Wild S., Zheng S. S., Beart P. M., Hertzog P. J., Kola I. (1998) J. Biol. Chem. 273, 22528–22536 - PubMed
    1. Forgione M. A., Cap A., Liao R., Moldovan N. I., Eberhardt R. T., Lim C. C., Jones J., Goldschmidt-Clermont P. J., Loscalzo J. (2002) Circulation 106, 1154–1158 - PubMed

Publication types

MeSH terms

Substances