. 2011 Nov;301(5):G877-86.
doi: 10.1152/ajpgi.00261.2011. Epub 2011 Aug 18.

Exploration of the copper-related compensatory response in the Belgrade rat model of genetic iron deficiency

Affiliations

Exploration of the copper-related compensatory response in the Belgrade rat model of genetic iron deficiency

Lingli Jiang et al. Am J Physiol Gastrointest Liver Physiol. 2011 Nov.

Abstract

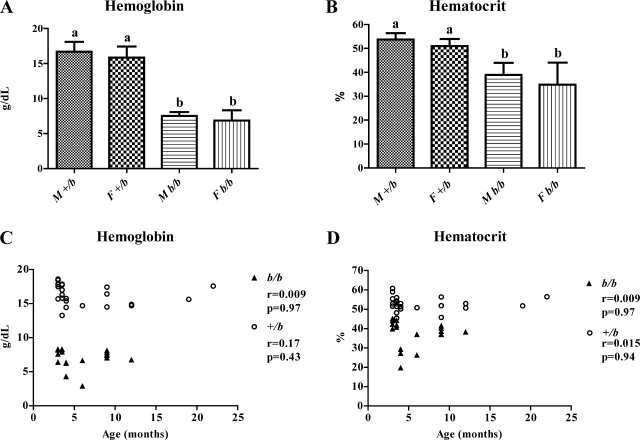
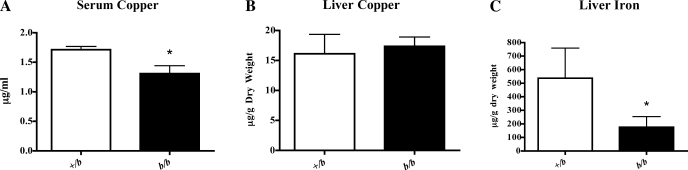
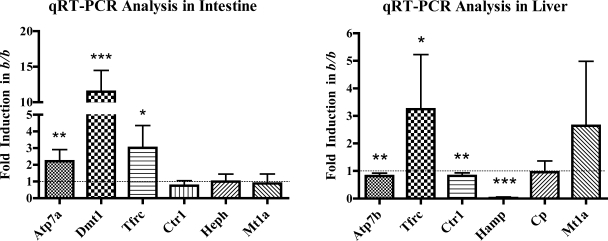
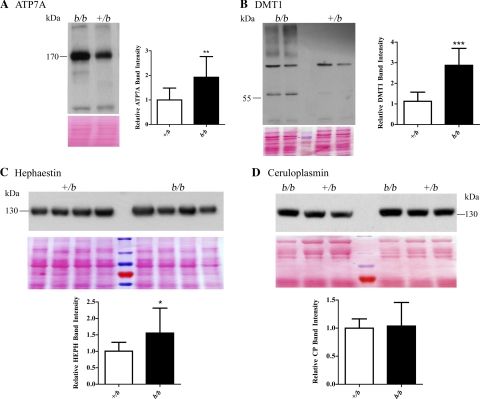
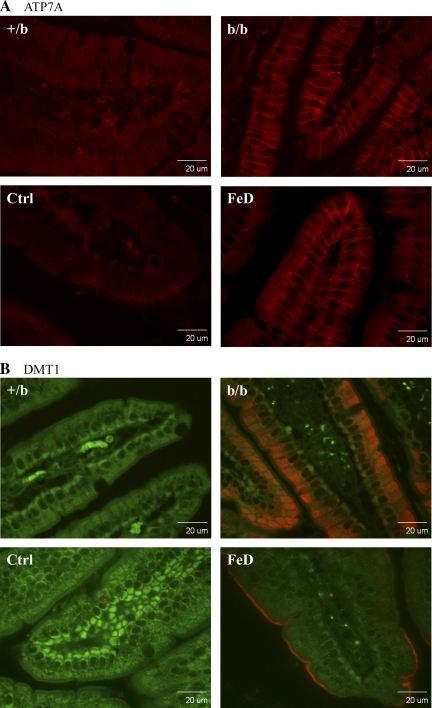
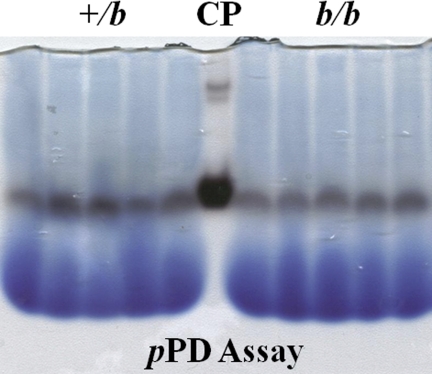
The Menkes copper ATPase (Atp7a) and metallothionein (Mt1a) are induced in the duodenum of iron-deficient rats, and serum and hepatic copper levels increase. Induction of a multi-copper ferroxidase (ceruloplasmin; Cp) has also been documented. These findings hint at an important role for Cu during iron deficiency. The intestinal divalent metal transporter 1 (Dmt1) is also induced during iron deficiency. The hypothesis that Dmt1 is involved in the copper-related compensatory response during iron deficiency was tested, utilizing a mutant Dmt1 rat model, namely the Belgrade (b/b) rat. Data from b/b rats were compared with phenotypically normal, heterozygous +/b rats. Intestinal Atp7a and Dmt1 expression was increased in b/b rats, whereas Mt1a expression was unchanged. Serum and liver copper levels did not increase in the Belgrades nor did Cp protein or activity. The lack of fully functional Dmt1 may thus partially blunt the compensatory response to iron deficiency by 1) decreasing copper levels in enterocytes, as exemplified by a lack of Mt1a induction and a lesser induction of Atp7a, 2) abolishing the frequently described increase in liver and serum copper, and 3) attenuating the documented increase in Cp expression and activity.


Figures

Fig. 1.
Fig. 1.
Hematological status of experimental animals. Hemoglobin (Hb) (A) and hematocrit (Hct) (B) levels are shown graphically. M, male; F, female. a,bStatistically different from one another (P < 0.05). Means ± SD are shown. Correlation analysis was performed to compare Hb and Hct to age, as seen in C and D, respectively. r, Pearson Correlation coefficient. n = 24 for +/bs; n = 18 for b/bs.
Fig. 2.
Fig. 2.
Copper content in rat serum and hepatic iron and copper content. A: serum copper level. B: liver copper content. Serum, n = 3 for +/b and n = 4 for b/b; Liver, n = 6 for +/b and n = 4 for b/b. C: hepatic iron content (n = 6 for +/b and n = 4 for b/b). Means ± SD are shown. *Statistically significant differences between genotypes (P < 0.05).
Fig. 3.
Fig. 3.
qRT-PCR analysis of intestinal and hepatic gene expression. qRT-PCR was performed with RNA samples extracted from isolated enterocytes (left) and liver (right) of +/b and b/b rats. Experimental repetitions utilizing different groups of +/b or b/b animals were as follows: +/b, n = 19 and b/b, n = 13 for intestine; +/b, n = 24 and b/b, n = 18 for liver. Y-axis shows fold change in b/bs compared with +/bs. The dashed line corresponding to 1.0-fold change (i.e., no change) on the y-axis is shown in both panels; bars below 1.0 indicate decreases, and bars above indicate increases in the b/b compared with the +/bs. *P < 0.05, **P < 0.01, ***P < 0.001; all indicating significant differences between genotypes. Means ± SD are shown. Atp7a, Menkes copper transporting ATPase; Atp7b, Wilson's copper transporting ATPase; Cp, ceruloplasmin; Ctr1, copper transporter 1; Dmt1, divalent metal transporter 1; Hamp, hepcidin; Heph, hephaestin; Mt1a, metallothionein 1A; Tfrc, transferrin receptor 1.
Fig. 4.
Fig. 4.
Western blot analysis of iron/copper-related proteins. In each panel, a representative Western blot is shown along with quantitative data from all rats studied. Numbers beside the Western blots indicate the placement of the closest molecular weight marker. Band intensities were normalized vs. total protein on the stained blots (shown below each lane of the Western blots). In A, B and C, membrane proteins extracted from enterocytes were reacted with antibodies against the respective proteins. A: anti-ATP7A antibody (+/b, n = 12 and b/b, n = 7). B: anti-DMT1 antibody (+/b, n = 10 and b/b, n = 6). The band just above 55 kDa was quantified (See discussion for explanation). C: anti-HEPH antibody (+/b, n = 15 and b/b, n = 8). D: serum proteins were reacted with anti-Cp antibody (+/b, n = 13 and b/b, n = 7). *P < 0.05, **P < 0.01, ***P < 0.001; all indicating significant differences between genotypes. Means ± SD are shown.
Fig. 5.
Fig. 5.
Immunohistochemical analysis of Atp7a and Dmt1 protein expression in rat duodenum. Fixed tissue sections were reacted with the anti-Atp7a- or -Dmt1-specific antiserum followed by a fluorescent-tagged secondary antibody and imaged with a confocal microscope. A: Atp7a protein is depicted by the red color. B: autofluorescence is shown (green) along with the specific signal (red color) depicting the Dmt1 protein. The confocal settings remained constant across all images. Images are typical of several experiments. Ctrl, control Sprague Dawley (SD) rat; FeD, iron-deficient SD rat.
Fig. 6.
Fig. 6.
In-gel serum Cp activity assays. Serum samples were separated by native gel electrophoresis and subsequently reacted with the substrate (para-Phenylenediamine, pPD) to estimate enzyme activity levels. The site of enzyme activity is represented by the dark bands just below the midpoint of the gel. The blue, diffuse bands at the bottom of the gel are loading dye. Each genotype is represented by samples from 5 individual rats. Purified human Cp protein was used as positive control (CP).

Similar articles

Cited by

References

    1. Anderson GJ, Frazer DM, McKie AT, Vulpe CD. The ceruloplasmin homolog hephaestin and the control of intestinal iron absorption. Blood Cells Mol Dis 29: 367–375, 2002 - PubMed
    1. Arredondo M, Munoz P, Mura CV, Nunez MT. DMT1, a physiologically relevant apical Cu1+ transporter of intestinal cells. Am J Physiol Cell Physiol 284: C1525–C1530, 2003 - PubMed
    1. Bremner I. Involvement of metallothionein in the hepatic metabolism of copper. J Nutr 117: 19–29, 1987 - PubMed
    1. Canonne-Hergaux F, Fleming MD, Levy JE, Gauthier S, Ralph T, Picard V, Andrews NC, Gros P. The Nramp2/DMT1 iron transporter is induced in the duodenum of microcytic anemia mk mice but is not properly targeted to the intestinal brush border. Blood 96: 3964–3970, 2000 - PubMed
    1. Cartwright GE, Huguley CM, Jr, Aschenbrucker H, Fay J, Wintrobe MM. Studies on free erythrocyte protoporphyrin, plasma iron and plasma copper in normal and anemic subjects. Blood 3: 501–525, 1948. - PubMed

Publication types

Substances

LinkOut - more resources