. 2011 Oct;32(9):1652-7.
doi: 10.3174/ajnr.A2596. Epub 2011 Aug 18.

Optimal presentation modes for detecting brain tumor progression

Affiliations

Optimal presentation modes for detecting brain tumor progression

B J Erickson et al. AJNR Am J Neuroradiol. 2011 Oct.

Abstract

Background and purpose: A common task in radiology interpretation is visual comparison of images. The purpose of this study was to compare traditional side-by-side and in-place (flicker) image presentation modes with advanced methods for detecting primary brain tumors on MR imaging.

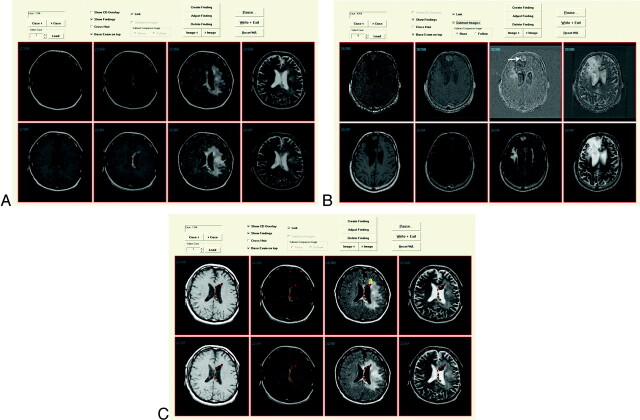
Materials and methods: We identified 66 patients with gliomas and 3 consecutive brain MR imaging examinations (a "triplet"). A display application that presented images in side-by-side mode with or without flicker display as well as display of image subtraction or automated change detection information (also with and without flicker display) was used by 3 board-certified neuroradiologists. They identified regions of brain tumor progression by using this display application. Each case was reviewed using all modes (side-by-side presentation with and without flicker, subtraction with and without flicker, and change detection with and without flicker), with results compared via a panel rating.

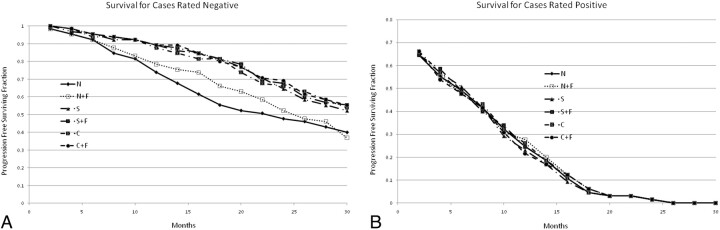
Results: Automated change detection with or without flicker (P < .0027) as well as subtraction with or without flicker (P < .0027) were more sensitive to tumor progression than side-by-side presentation in cases where all 3 raters agreed. Change detection afforded the highest interrater agreement, followed by subtraction. Clinically determined time to progression was longer for cases rated as nonprogressing by using subtraction images and change-detection images both with and without flicker display mode compared with side-by-side presentation.

Conclusions: Automated change detection and image subtraction, with and without flicker display mode, are superior to side-by-side image comparison.


Figures

Fig 1.
Fig 1.
Example output of the automated change detection algorithm. Compared with simple image subtraction, change detection combines information from all multiple MR pulse sequences and uses knowledge about how progression or regression appears on the sequences, as well as standardized ways to set thresholds for true changes. Different colors represent different types of change, eg, red means new enhancement and T2 signal intensity abnormality, yellow means new nonenhancing T2 signal intensity abnormality, green means reduced T2 signal intensity abnormality, and purple means less enhancement and less T2 signal intensity abnormality.
Fig 2.
Fig 2.
A, Display application showing old (B = baseline) and new (F = follow-up) examinations in an above/below format. Note that this case allows the user to view the automated change detection overlay (the “Show CD Overlay” checkbox is enabled) but not image subtraction (“Subtract Images” is disabled). This also allows flicker mode, because the “Base Examination on Top” checkbox is enabled. Checking or unchecking that box changes whether the top row shows the baseline or follow-up examination. B, Display application with subtraction image, showing slight enlargement of the tumor nodule in the right frontal region (white arrow). C, Display application showing color change detection overlay on the images, as well as radiologist marking indicating progression, with confidence level of 3 (third image, top row).
Fig 3.
Fig 3.
A, Survival curves for each display method, when all of the raters determined there was no progression. This graph demonstrates that methods by using flicker display help to correctly identify the cases that are negative (that will have long times until progression). The N method was significantly different from the others at the P < .05 level, but there was no difference between the other methods. B, Survival curves for each display method, when all raters determined that there was tumor progression. This graph suggests that the “normal” display mode (with or with flicker) identified some cases as progressers that actually will not progress in the near term. The differences were not statistically significant.

References

    1. Matsuo Y, Shimizu A, Kobatake H. An interval change detection method for two chest X-ray images with different rotation angles of the human body and its performance evaluation. Syst Comput Jpn 2007; 36: 30–42
    1. Resnick RA, O'Regan JK, Clark JJ. To see or not to see: the need for attention to perceive changes in scenes. Psych Sci 1997; 8: 368–77
    1. Patriarche J, Erickson B. Part 1. Automated change detection and characterization in serial MR studies of brain-tumor patients. J Digit Imaging 2007; 20: 203–22 - PMC - PubMed
    1. Patriarche J, Erickson B. Part 2. Automated change detection and characterization applied to serial MR of brain tumors may detect progression earlier than human experts. J Digit Imaging 2007; 20: 321–28 - PMC - PubMed
    1. Therasse P, Arbuck SG, Eisenhauer EA, et al. . New guidelines to evaluate the response to treatment in solid tumors. J Natl Cancer Inst 2000; 92: 205–16 - PubMed

Publication types