. 2011 Oct;138(19):4131-42.
doi: 10.1242/dev.065870. Epub 2011 Aug 18.

Activin and GDF11 collaborate in feedback control of neuroepithelial stem cell proliferation and fate

Affiliations

Activin and GDF11 collaborate in feedback control of neuroepithelial stem cell proliferation and fate

Kimberly K Gokoffski et al. Development. 2011 Oct.

Abstract

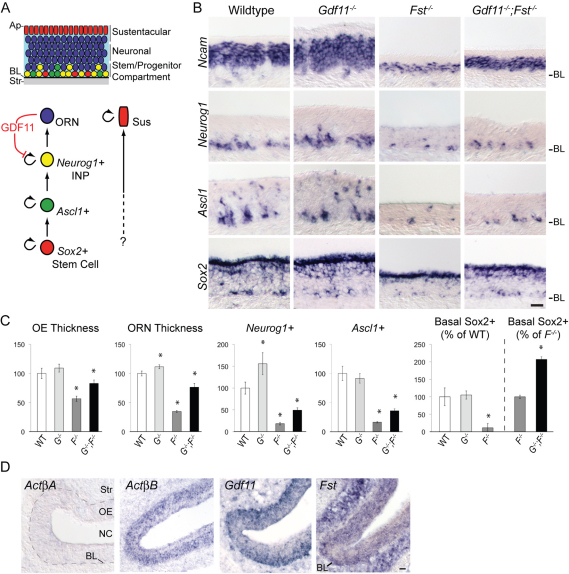
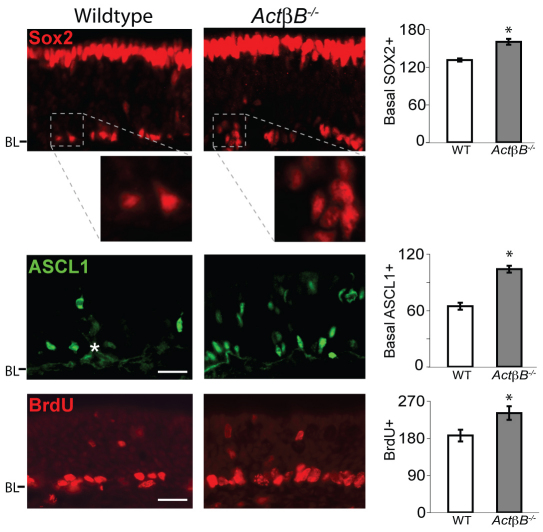
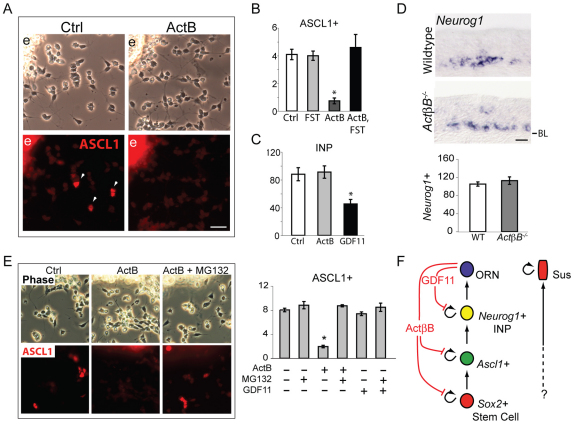
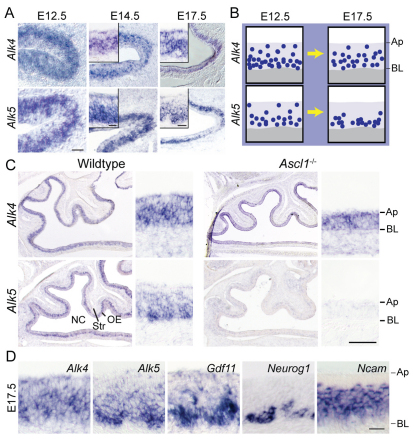
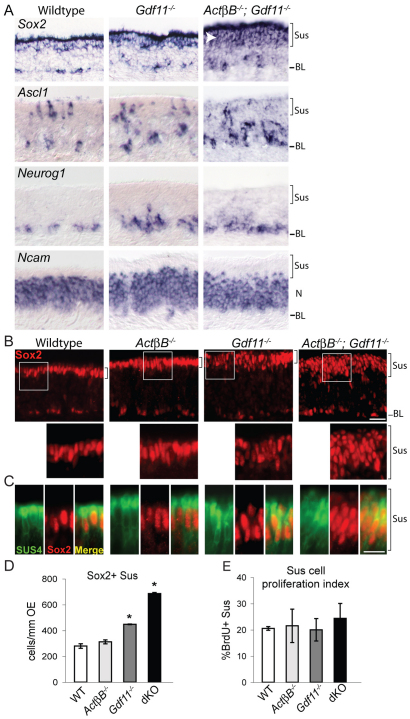
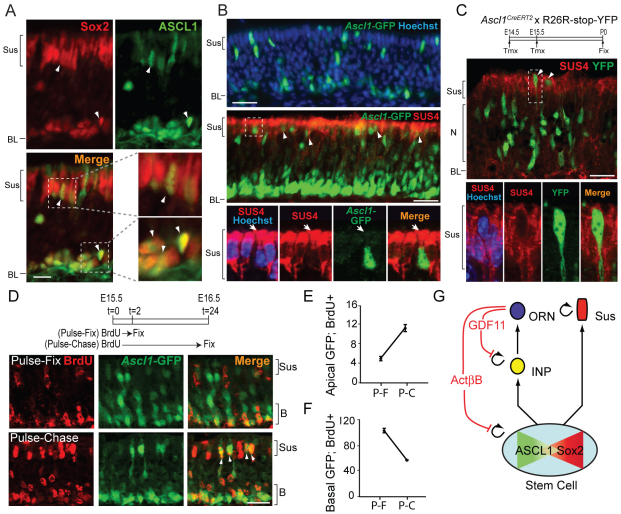
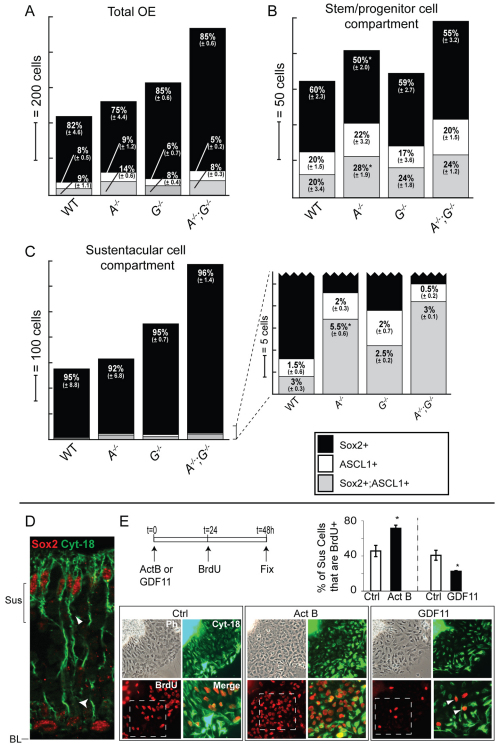
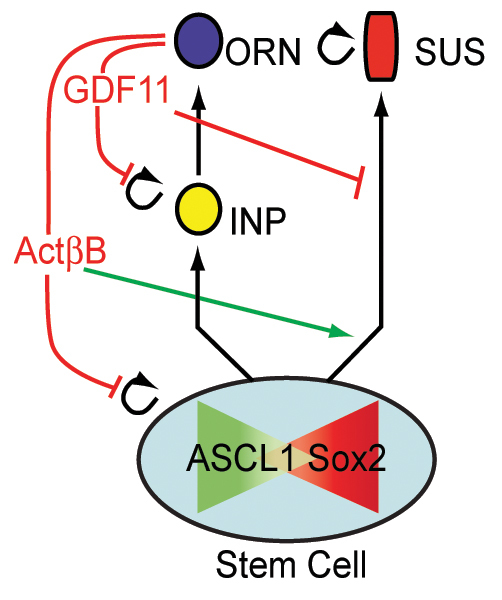
Studies of the olfactory epithelium model system have demonstrated that production of neurons is regulated by negative feedback. Previously, we showed that a locally produced signal, the TGFβ superfamily ligand GDF11, regulates the genesis of olfactory receptor neurons by inhibiting proliferation of the immediate neuronal precursors (INPs) that give rise to them. GDF11 is antagonized by follistatin (FST), which is also produced locally. Here, we show that Fst(-/-) mice exhibit dramatically decreased neurogenesis, a phenotype that can only be partially explained by increased GDF11 activity. Instead, a second FST-binding factor, activin βB (ACTβB), inhibits neurogenesis by a distinct mechanism: whereas GDF11 inhibits expansion of INPs, ACTβB inhibits expansion of stem and early progenitor cells. We present data supporting the concept that these latter cells, previously considered two distinct types, constitute a dynamic stem/progenitor population in which individual cells alternate expression of Sox2 and/or Ascl1. In addition, we demonstrate that interplay between ACTβB and GDF11 determines whether stem/progenitor cells adopt a glial versus neuronal fate. Altogether, the data indicate that the transition between stem cells and committed progenitors is neither sharp nor irreversible and that GDF11, ACTβB and FST are crucial components of a circuit that controls both total cell number and the ratio of neuronal versus glial cells in this system. Thus, our findings demonstrate a close connection between the signals involved in the control of tissue size and those that regulate the proportions of different cell types.


Figures

Fig. 1.
Fig. 1.
Partial recovery of neurogenesis in Gdf11–/–;Fst–/– mouse olfactory epithelium (OE). (A) Schematic of OE structure and lineage. The origin of sustentacular (Sus) cells is uncertain. (B) In situ hybridization (ISH) for the indicated markers. (C) OE thickness (μm), olfactory receptor neuron (ORN; Ncam+) layer thickness (μm), and Neurog1-, Ascl1- and basal Sox2-expressing cells are plotted per mm OE and normalized as a percentage of wild type. Error bars indicate root mean square; *, P≤0.05 by Dunnett's test [DT (Glantz, 2005)]. (D) ISH with the indicated probes. BL, basal lamina; NC, nasal cavity; Str, stroma. Scale bars: 20 μm.
Fig. 2.
Fig. 2.
Increase in SOX2+ and ASCL1+ cells in ActβB–/– OE. Bar charts show cells/mm OE (mean ± s.e.m.; *, P≤0.05 DT). White asterisk, Bowman's gland. BL, basal lamina. Scale bars: 20 μm.
Fig. 3.
Fig. 3.
ACTB limits development of ASCL1+ cells in vitro. (A,B) Mouse OE explants (`e') cultured for 8 hours in ACTB (10 ng/ml) and/or FST (200 ng/ml). White arrowheads indicate ASCL1+ cells. Bar chart shows percentage of cells that are ASCL1+ (mean ± s.e.m.; *, P≤0.05 DT). (C) TgN1-2G+/– explants were cultured for a total of 30 hours, with ACTB (20 ng/ml) or GDF11 (20 ng/ml) added for the final 18 hours in vitro. GFP+ (Neurog1+) immediate neuronal precursors (INPs) were analyzed as described (Wu et al., 2003) and are plotted as mean (± s.e.m.) per 15,000 μm2 explant. *, P≤0.05 by DT. (D) Neurog1 ISH in ActβB–/– and control OE. Bar chart shows mean ± s.e.m. (E) OE explants were cultured for 6 hours, then ACTB or GDF11 (20 ng/ml) was added for 2 hours. MG132 (10 μM) or control (0.1% DMSO in medium) was added 30 minutes prior to ACTB or GDF11 addition. Analysis as in A. (F) Schematic showing actions of ACTβB and GDF11 on the ORN lineage. BL, basal lamina. Scale bars: 20 μm.
Fig. 4.
Fig. 4.
Expression of Alk5, but not Alk4, requires Ascl1 function. (A) ISH in wild-type mouse OE. (B) Schematic of developmental changes in Alk4 and Alk5 expression. Blue circles, represent Alk4- or Alk5-expressing cells. (C) ISH in Ascl1–/– and wild-type OE. (D) Wild-type OE hybridized with the indicated probes. Ap, apical surface; BL, basal lamina; NC, nasal cavity; Str, stroma. Scale bars: 50 μm in C, A E12.5; 20 μm in D, A E14.5 and E17.5.
Fig. 5.
Fig. 5.
Increased Sus cells in Gdf11–/– and ActβB–/–;Gdf11–/– OE. (A) ISH with the indicated probes indicates increased Sox2 expression and a thicker Sus layer (white arrowhead) in ActβB–/–;Gdf11–/– OE. (B) Magnified images show apical SOX2+ cells outlined by white boxes. (C) Most apical SOX2+ cells are also SUS4+ [83±2% (±s.e.m.)]. (D) Mean number of SOX2+ Sus cells/mm OE (± s.e.m.; *, P≤0.05 DT). (E) SOX2+ Sus cells and the percentage of these that are BrdU+ (`proliferation index') plotted as mean ± s.e.m. dKO, ActβB–/–;Gdf11–/–. BL, basal lamina; N, neuronal layer; Sus, sustentacular layer. Scale bars: 20 μm in A,B; 10 μm in C.
Fig. 6.
Fig. 6.
Ascl1-expressing cells give rise directly to Sus cells. (A) Immunofluorescence (IF) for SOX2 and ASCL1 in wild-type OE. White arrowheads indicate SOX2+; ASCL1+ cells. (B) In Ascl1GFP/+ OE, apical GFP+ cells are SUS4+ (arrowheads). The bottom row shows a z-stack image (2 μm spacing) of the boxed cell. Arrows indicate a SUS4+; GFP+ cell. (C) Pregnant dams were injected with tamoxifen (Tmx; see Materials and methods) and SUS4 IF performed on P0 OE. The bottom row shows a z-stack image (0.5 μm spacing) of the boxed cell. (D) BrdU was administered to pregnant dams (Ascl1GFP/+) and GFP+ and BrdU+ cells analyzed in Sus and basal (`B') compartments at the times indicated. (E,F) Quantification of experiments in D, plotted as mean GFP+ BrdU+ cells/mm OE (± s.d.). P-F, pulse-fix; P-C, pulse-chase. (G) Schematic showing feedback and dynamic expression of Sox2 and/or Ascl1 by a stem cell. BL, basal lamina; N, neuronal layer; Sus, sustentacular layer. Scale bars: 20 μm.
Fig. 7.
Fig. 7.
ActβB and GDF11 modulate stem cell fates. (A-C) Cells in three marker categories (SOX2+, black; ASCL1+, white; SOX2+; ASCL1+, gray) were quantified for (A) total OE, (B) basal stem/progenitor cell compartment and (C) apical sustentacular cell compartment. The height of each shaded segment in a bar indicates the total number of cells/mm OE for that category. The percentage of cells in a given compartment [± error (root mean square)] for each marker category is indicated. *, P≤0.05 (DT) compared with wild type. A, ActβB; G, Gdf11. (D) z-stack image (0.3 μm spacing) of SOX2 and cytokeratin 18 IF. White arrowheads indicate a Sus cell that is SOX2+; CYT18+. (E) Sus cultures were treated with ACTB (20 ng/ml) or GDF11 (20 ng/ml). BrdU (1:10,000) was added for the final 24 hours in vitro. Bar charts show mean ± s.e.m. (*, P≤0.05, Student's t-test). White arrowheads in the magnified image point to BrdU+ CYT18+ cells. Ph, phase contrast image; BL, basal lamina; Sus, sustentacular layer.
Fig. 8.
Fig. 8.
Schematic of OE lineages showing distinct roles for GDF11 and ACTβB feedback. In the ORN pathway, GDF11 feedback limits INP proliferation, whereas ACTβB feedback inhibits proliferation of stem cells that give rise to INPs. In the Sus pathway, GDF11 antagonizes, whereas ACTβB promotes, stem cell development into Sus cells.

Similar articles

Cited by

References

    1. Andersson O., Reissmann E., Ibanez C. F. (2006). Growth differentiation factor 11 signals through the transforming growth factor-beta receptor ALK5 to regionalize the anterior-posterior axis. EMBO Rep. 7, 831-837 - PMC - PubMed
    1. Attisano L., Wrana J. L., Montalvo E., Massague J. (1996). Activation of signalling by the activin receptor complex. Mol. Cell. Biol. 16, 1066-1073 - PMC - PubMed
    1. Battiste J., Helms A. W., Kim E. J., Savage T. K., Lagace D. C., Mandyam C. D., Eisch A. J., Miyoshi G., Johnson J. E. (2007). Ascl1 defines sequentially generated lineage-restricted neuronal and oligodendrocyte precursor cells in the spinal cord. Development 134, 285-293 - PubMed
    1. Baumgardt M., Karlsson D., Terriente J., Diaz-Benjumea F. J., Thor S. (2009). Neuronal subtype specification within a lineage by opposing temporal feed-forward loops. Cell 139, 969-982 - PubMed
    1. Beites C. L., Kawauchi S., Crocker C. E., Calof A. L. (2005). Identification and molecular regulation of neural stem cells in the olfactory epithelium. Exp. Cell Res. 306, 309-316 - PubMed

Publication types

MeSH terms