. 2011 Aug 19;333(6045):984-8.
doi: 10.1126/science.1204588.

Partitioning regulatory mechanisms of within-host malaria dynamics using the effective propagation number

Affiliations

Partitioning regulatory mechanisms of within-host malaria dynamics using the effective propagation number

C J E Metcalf et al. Science. .

Abstract

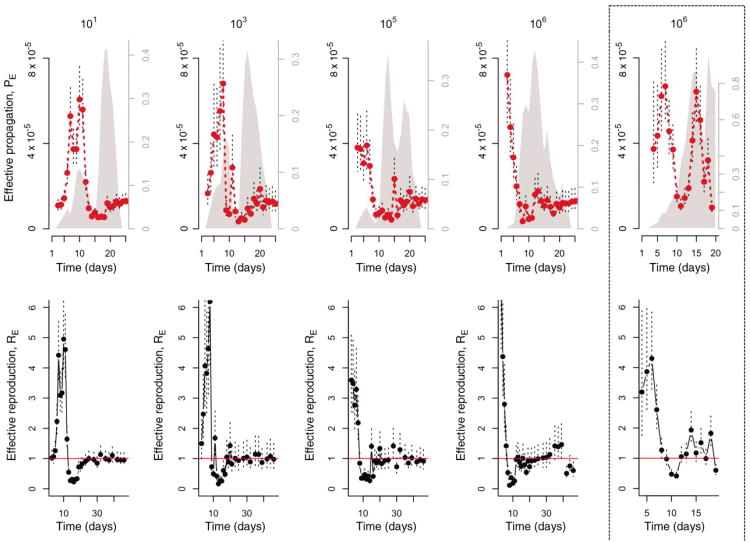
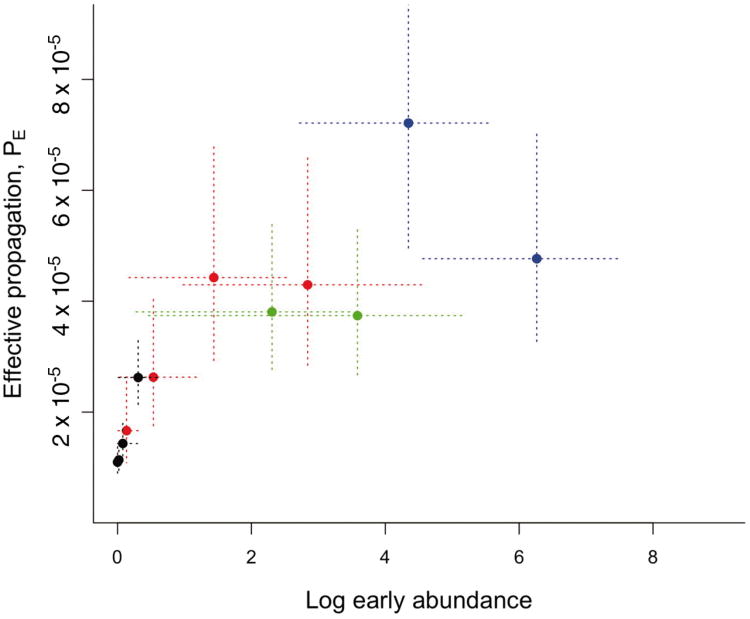
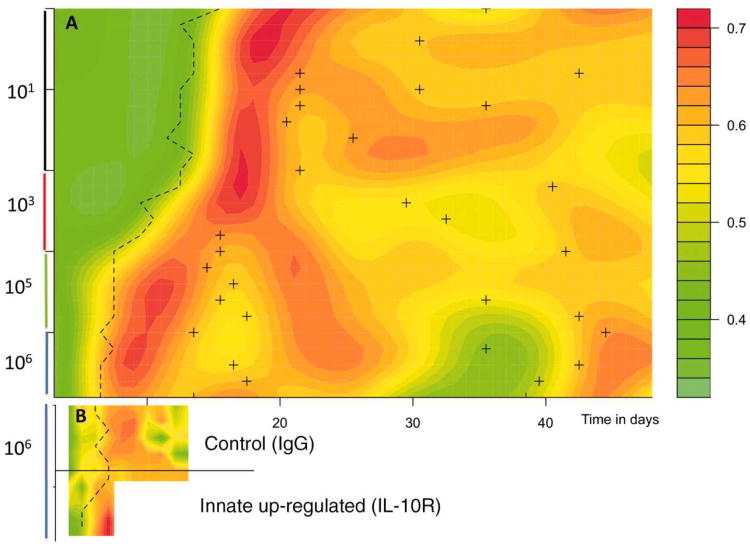
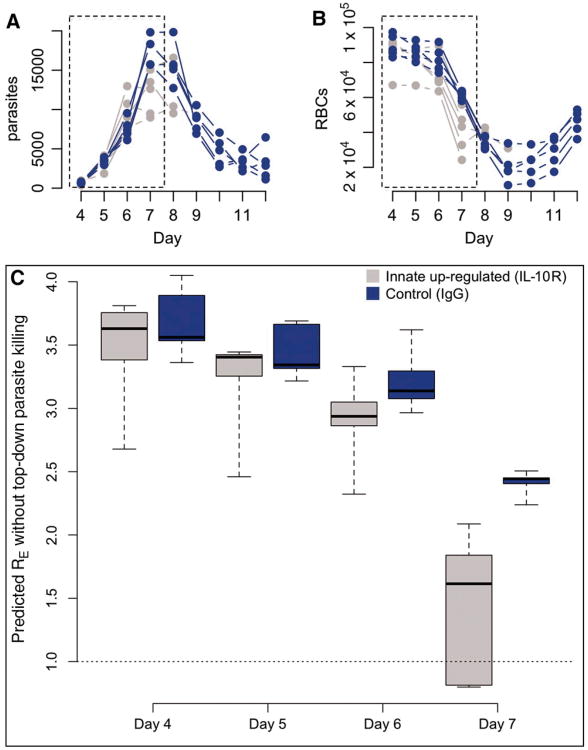
Immune clearance and resource limitation (via red blood cell depletion) shape the peaks and troughs of malaria parasitemia, which in turn affect disease severity and transmission. Quantitatively partitioning the relative roles of these effects through time is challenging. Using data from rodent malaria, we estimated the effective propagation number, which reflects the relative importance of contrasting within-host control mechanisms through time and is sensitive to the inoculating parasite dose. Our analysis showed that the capacity of innate responses to restrict initial parasite growth saturates with parasite dose and that experimentally enhanced innate immunity can affect parasite density indirectly via resource depletion. Such a statistical approach offers a tool to improve targeting of drugs or vaccines for human therapy by revealing the dynamics and interactions of within-host regulatory mechanisms.


Conflict of interest statement

Author information: The authors declare no competing interests.

Figures

Figure 1
Figure 1. Within-host effective propagation
The red line is the estimate of effective propagation for 5 or 10 intact AS infected mice with different inocula sizes (1-4th columns to the left) and 5 CD4+ T-cell depleted AS infected mice (far right, dashed enclosure). The size of the inocula is indicated by the title of each column (101, 103, 105, 106, CD4+ T-cell depleted mice inocula sizes are comparable to the largest levels used in intact mice); standard errors from the regression are shown as dashed vertical lines. Grey polygons show mean approximate proportion of RBCs aged 1-3 days, based on RBC-change reconstruction (right-hand axis). The bottom row shows the corresponding RE, up to day 50 for intact mice; PE changes little over the later days.
Figure 2
Figure 2. Decelerating control
Effective propagation over the first 2-4 days (with the last day set when PE,t starts to decay sharply, see Figure 1) for 4 different starting inoculation sizes (101 in black (n=10 mice, 3 days), 103 in red (n=5, 4 days), 105 in green (n=5, 2 days), 106 in blue (n=5, 2 days)) indicates a decelerating function of density suggestive of a handling-time type-effect for innate immunity; vertical lines are standard errors from the regression defining PE,t; horizontal lines are 95% quantiles for abundance of parasites observed on that day.
Figure 3
Figure 3. Visualizing efficacy of immunity
in A) intact mice for different starting inoculum sizes (y axis labels); and B) intact mice and intact mice treated with IL-10R, which up-regulates innate immunity (y axis labels to the right). Surfaces show smoothed proportion of infected cells killed, pt, against time in days (x axis) with mice ranked via their early densities within each category (rows, y axis); dashed thick line indicates the timing of the first major peak of infection; and for A) the crosses indicate secondary peaks, generally following dips in immune efficacy. In A) higher early densities experience an earlier increase in mortality of infected cells but this effect decays, then increases, finally dipping significantly around the 35th day associated with a resurgence of parasites. In B) mice treated with IL-10R experience an earlier peak in immune efficacy. However, treated mice generally died by day 9.
Figure 4
Figure 4. Top-down controls acting via bottom-up effects
Time-series (×10-2 per μl) of parasites (A) and RBCs (B) for mice treated with IL-10-R (grey, n=4) and controls (blue, n=4), and the corresponding estimate of the effective reproductive ratio, RE on days 4-7 (C) that would be observed in the absence of immune killing of infected cells obtained by combining RBC age-specific estimates of PE obtained from CD4+ T cell-depleted mice with the RBC dynamics and age-structure indicated by these time-series. Dotted regions in A and B show the time period plotted in C. In IL-10R treated mice, this predicted RE drops precipitously simply due to RBC depletion (B); and this anemia is not due to parasite levels, which remain comparable in controls and treated mice (A). This indicates that immune-mediated killing of uninfected RBCs is a key mechanism of control.

Comment in

Similar articles

Cited by

References

    1. Carter R, Walliker D. Annals of Tropical Medicine and Parasitology. 1975;69:187. - PubMed
    1. Molineaux L, Trauble M, Collins WE, Jeffery GM, Dietz K. Trans R Soc Trop Med Hyg. 2002;96:205. - PubMed
    1. Dietz K, Raddatz G, Molineaux L. American Journal of Tropical Medicine and Hygiene. 2006;75:46. - PubMed
    1. Haydon DT, Matthews L, Timms R, Colegrave N. Proceedings of the Royal Society of London - Series B. 2003;270:289. - PMC - PubMed
    1. Ribeiro RM, et al. Journal of Virology. 2010;84:6096. - PMC - PubMed

Publication types

MeSH terms