. 2011 Aug 15;25(16):1686-701.
doi: 10.1101/gad.16651211.

RNAi-independent role for Argonaute2 in CTCF/CP190 chromatin insulator function

Affiliations

RNAi-independent role for Argonaute2 in CTCF/CP190 chromatin insulator function

Nellie Moshkovich et al. Genes Dev. .

Abstract

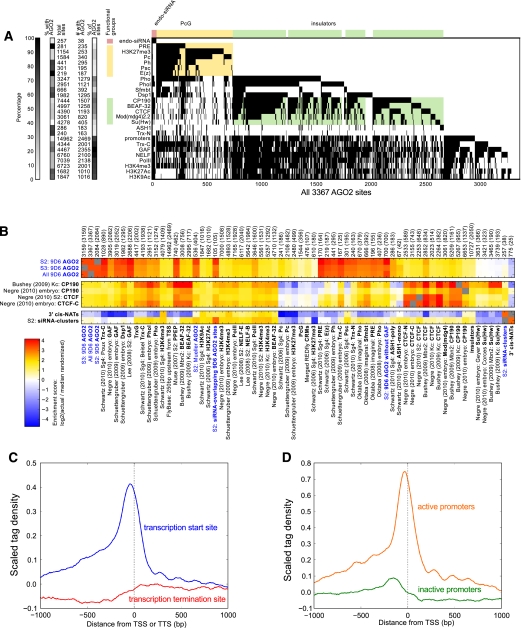
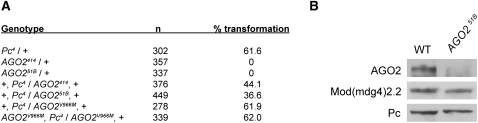
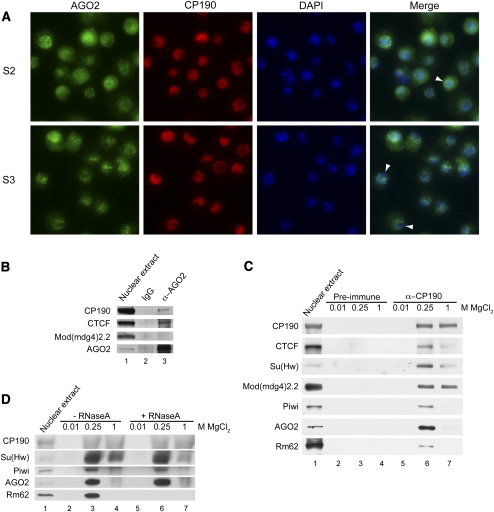
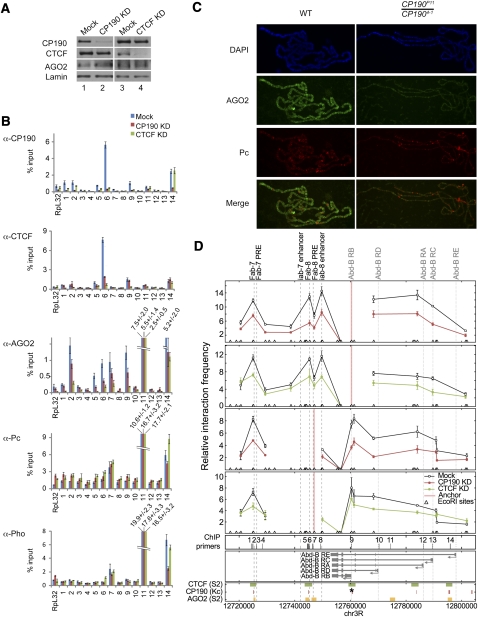
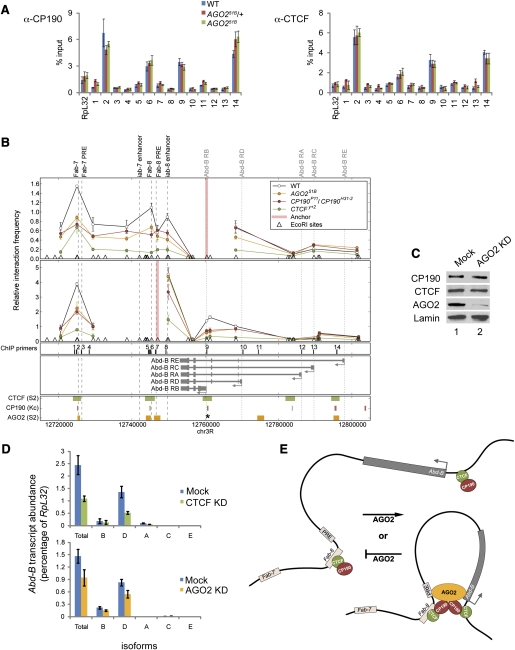
A major role of the RNAi pathway in Schizosaccharomyces pombe is to nucleate heterochromatin, but it remains unclear whether this mechanism is conserved. To address this question in Drosophila, we performed genome-wide localization of Argonaute2 (AGO2) by chromatin immunoprecipitation (ChIP)-seq in two different embryonic cell lines and found that AGO2 localizes to euchromatin but not heterochromatin. This localization pattern is further supported by immunofluorescence staining of polytene chromosomes and cell lines, and these studies also indicate that a substantial fraction of AGO2 resides in the nucleus. Intriguingly, AGO2 colocalizes extensively with CTCF/CP190 chromatin insulators but not with genomic regions corresponding to endogenous siRNA production. Moreover, AGO2, but not its catalytic activity or Dicer-2, is required for CTCF/CP190-dependent Fab-8 insulator function. AGO2 interacts physically with CTCF and CP190, and depletion of either CTCF or CP190 results in genome-wide loss of AGO2 chromatin association. Finally, mutation of CTCF, CP190, or AGO2 leads to reduction of chromosomal looping interactions, thereby altering gene expression. We propose that RNAi-independent recruitment of AGO2 to chromatin by insulator proteins promotes the definition of transcriptional domains throughout the genome.


Figures

Figure 1.
Figure 1.
ChIP-seq profiles of AGO2 in S2 and S3 cells at BX-C. AGO2 ChIP-seq profiles of input DNA and immunoprecipitations in S2 and S3 cells compared with tiling array ChIP data for CTCF, CP190, GAF (Negre et al. 2010), Trx-N, Pho, and Pc (Schuettengruber et al. 2009) in indicated cell types or embryos over the BX-C region (top) and Abd-B locus (bottom). Coding sequences, promoters, and cis-regulatory regions are shown. ChIP-seq scales are in reads per million unique mapped reads. Input samples are shown on the same scale relative to respective immunoprecipitation and are therefore directly comparable. ChIP–chip data are expressed as either log2 (IP/input) or MA2C score. The bottom of each scale bar indicates 0.
Figure 2.
Figure 2.
Overlap between genome-wide binding sites of AGO2, insulator, TrxG/PcG, transcription-related factors, and promoters. (A) Binary heat map of AGO2-binding sites ordered by supervised hierarchical clustering. Each column represents one of the 3367 AGO2-binding sites across both S2 and S3 cell types, and each row represents overlapping binding sites for a particular factor across all available data sets. A mark in a row indicates that the indicated protein colocalizes with AGO2 at that site. AGO2 sites are classified into functional groups (endo-siRNA, PcG, and insulators). Feature counts for each factor and the number of features that intersect with the set of all AGO2 sites are shown. (Left) Corresponding percentages of overlap for each factor or for AGO2 are represented as grayscale values. (B) Heat map of log2 enrichment scores for pairwise comparisons of binding sites for AGO2, CP190, CTCF, 3′ cis-NATs, and endo-siRNA clusters with additional data sets. Enrichment score was calculated by dividing the actual overlapping feature count by the median overlapping feature count from 1000 random shufflings of features. Empirical P-values reported in the text are the percentile of the actual overlapping feature count in this null distribution. (Left) Color scale corresponding to enrichment value is indicated. Positive values indicate significant enrichment, while negative values indicate significant negative correlation of enrichment. Self–self comparisons are indicated in gray, and pairwise comparisons that are not statistically significant (P > 0.001) are indicated in white. Numbers along the top of each column indicate the total number of features in each data set, and the number of sites that interact with all AGO2 sites are indicated in parentheses. Full heat map with hierarchical clustering is shown in Supplemental Figure S3. (C) Half of AGO2-binding sites correspond to promoters. Profile of S2 AGO2 ChIP-seq tag density subtracted by input density around TSSs (blue) or transcription termination sites (red) from coding genes (FlyBase release 5.23) generated using CEAS. (D) AGO2 associates preferentially with active promoters. Profile of S2 AGO2 ChIP-seq tag density subtracted by input density around TSSs associated (orange) or not associated (green) with H3K4me2 and Pol II 250 bp upstream or 750 bp downstream.
Figure 3.
Figure 3.
AGO2 behaves as a TrxG protein. (A) Percentage of adult male flies displaying second and/or third legs with at least one ectopic sex comb tooth as an indication of posterior-to-anterior transformation was scored in the indicated genotypes, and number of flies (n) scored is shown. (B) Western blotting of AGO2, Pc, and Mod(mdg4)2.2 in wild-type and AGO251B adult male extracts.
Figure 4.
Figure 4.
AGO2, but not its catalytic activity, is required for Fab-8 insulator function. (A) Eye color due to expression of a transgenic construct carrying no regulatory element (top row), Fab-8 insulator and PRE (middle row), or Fab-8 PRE (bottom row) between the mini-white enhancer and its coding sequence in wild-type, AGO2414/+, AGO251B/+ AGO2414, AGO251B, and AGO2V966M flies. (B) Visualization of insulator bodies by indirect immunofluorescence of whole-mount larval imaginal discs using α-CP190 antibodies (red) merged with DAPI staining (blue) in wild type and AGO251B mutants. (C) Polytene chromosome staining of α-CTCF (green), α-CP190 (red), and merged images in wild type and AGO251B mutants. Arrows point to the BX-C locus. (D) Western blotting of CP190, CTCF, and Pep (loading control) in wild-type and AGO251B pupal extracts.
Figure 5.
Figure 5.
AGO2 associates physically with CP190 and CTCF. (A) Indirect immunofluorescence of S2 and S3 cells using α-AGO2 (green) and α-CP190 (red) antibodies. DAPI staining (blue) and merged image of α-AGO2 with DAPI are also shown. Arrowheads point to heterochromatic regions that stain intensely with DAPI but are depleted for AGO2. (B) Western blotting of embryonic nuclear extracts immunoprecipitated with α-AGO2 antibodies. Nuclear extract (lane 1) bound to control IgG (lane 2) or α-AGO2 immobilized on ProtA-sepharose (lane 3) at >1.1 M monovalent salt concentration. (C) Western blotting of embryonic nuclear extracts (lane 1) bound to a control preimmune column (lanes 2–4) or α-CP190 column (lanes 5–7) and step-eluted with increasing MgCl2 concentrations as indicated. (D) Western blotting of embryonic nuclear extracts (lane 1) bound to α-CP190 columns either untreated (lanes 2–4) or treated with RNaseA (lanes 5–7) and step-eluted with increasing MgCl2 concentrations as indicated.
Figure 6.
Figure 6.
CP190 and CTCF are required for AGO2 chromatin association and looping interactions throughout the Abd-B locus. (A) Western blotting of lysates from S2 cells mock-treated (lanes 1,3) or transfected with CP190 (lane 2) or CTCF (lane 4) dsRNA. (B) S2 cells mock-treated (blue) or transfected with CP190 (red) or CTCF (green) dsRNA were subjected to ChIP using α-CP190, α-CTCF, α-AGO2, α-Pho, and α-Pc antibodies. Locations of primer sets are indicated in D. Percent input DNA immunoprecipitated is shown for each primer set, and error bars indicate standard deviation of quadruplicate PCR measurements. IgG-negative control immunoprecipitations for all sites yielded <0.08% input. (C) AGO2 chromatin association is reduced in CP190 mutant polytene chromosomes. Salivary gland polytene chromosome staining with DAPI (blue), α-AGO2 (green), α-Pc (red), and red/green merged images from wild-type (left) and CP190P11/CP1904-1 (right) larvae. (D) 3C looping interactions between cis-regulatory elements of the Abd-B locus are dependent on CP190 and CTCF. Relative interaction frequencies between EcoRI restriction fragments (triangles) and anchor regions (red vertical lines) are shown for mock (open circles), CP190-depleted cells (filled red circles), and CTCF-depleted cells (filled green circles). Samples are normalized by qPCR to an undigested locus. Error shown is standard deviation of quadruplicate TaqMan PCR reactions. Reported peaks for CTCF (red) and CP190 (green) ChIP–chip studies and MACS-determined peaks for AGO2 (orange) are shown (below). The asterisk notes a site (primer set 9) not identified by MACS but with clear enrichment for AGO2 as determined by directed ChIP in B.
Figure 7.
Figure 7.
AGO2 is required for looping interactions throughout the Abd-B locus and proper gene expression. (A) CTCF and CP190 chromatin association is unaffected in AGO251B-null mutants. Adult heads of wild type (blue) as well as AGO251B/+ (red) or AGO251B (green) derived from AGO251B germline clones were subjected to ChIP using α-CP190 and α-CTCF. Locations of primer sets are indicated in B. Percent input DNA immunoprecipitated is shown for each primer set, and error bars indicate standard deviation of quadruplicate PCR measurements. (B) 3C looping interactions between cis-regulatory elements of the Abd-B locus are dependent on AGO2. Relative interaction frequencies between EcoRI restriction fragments (triangles) and anchor regions (red vertical lines) are shown for wild type (open circles) and CP190P11/CP190H31-2 (filled red circles), CTCFy+2 (filled green circles), and AGO251B (filled orange circles) mutant larval brains and imaginal discs. (C) Western blotting of lysates from S3 cells mock-treated (lane 1) or transfected with AGO2 siRNA (lane 2). (D) AGO2 and CTCF are required for proper Abd-B expression. RT–PCR to detect a common region or isoforms of Abd-B transcripts relative to RpL32 in oligo(dT) primed cDNA of S3 cells mock-treated (blue), CTCF-depleted (green), and AGO2-depleted (orange). Quantitative SYBR green PCR was performed in quadruplicate using S3 genomic DNA as a standard to normalize for primer efficiencies. (E) Model for AGO2 function with respect to CTCF/CP190 chromatin insulator activity. Looping at the Abd-B locus between the Fab-8 insulator and Abd-B promoter is dependent on CTCF/CP190 insulator interactions. This specialized configuration promotes interactions between Fab-8-associated cis-regulatory elements and the promoters to facilitate proper gene expression. AGO2 is recruited depending on CTCF/CP190 chromatin association and acts to either promote or stabilize looping interactions. Transfer of AGO2 to noninsulator sites may be achieved through CTCF/CP190-dependent looping interactions.

References

    1. Amero SA, Elgin SC, Beyer AL 1991. A unique zinc finger protein is associated preferentially with active ecdysone-responsive loci in Drosophila. Genes Dev 5: 188–200 - PubMed
    1. Bailey TL, Elkan C 1995. The value of prior knowledge in discovering motifs with MEME. Proc Int Conf Intell Syst Mol Biol 3: 21–29 - PubMed
    1. Bantignies F, Roure V, Comet I, Leblanc B, Schuettengruber B, Bonnet J, Tixier V, Mas A, Cavalli G 2011. Polycomb-dependent regulatory contacts between distant Hox loci in Drosophila. Cell 144: 214–226 - PubMed
    1. Barges S, Mihaly J, Galloni M, Hagstrom K, Muller M, Shanower G, Schedl P, Gyurkovics H, Karch F 2000. The Fab-8 boundary defines the distal limit of the bithorax complex iab-7 domain and insulates iab-7 from initiation elements and a PRE in the adjacent iab-8 domain. Development 127: 779–790 - PubMed
    1. Beisel C, Buness A, Roustan-Espinosa IM, Koch B, Schmitt S, Haas SA, Hild M, Katsuyama T, Paro R 2007. Comparing active and repressed expression states of genes controlled by the Polycomb/Trithorax group proteins. Proc Natl Acad Sci 104: 16615–16620 - PMC - PubMed

Publication types

MeSH terms

Associated data