. 2011 Aug 15;25(16):1716-33.
doi: 10.1101/gad.16771811.

Erk regulation of pyruvate dehydrogenase flux through PDK4 modulates cell proliferation

Affiliations

Erk regulation of pyruvate dehydrogenase flux through PDK4 modulates cell proliferation

Alexandra R Grassian et al. Genes Dev. .

Abstract

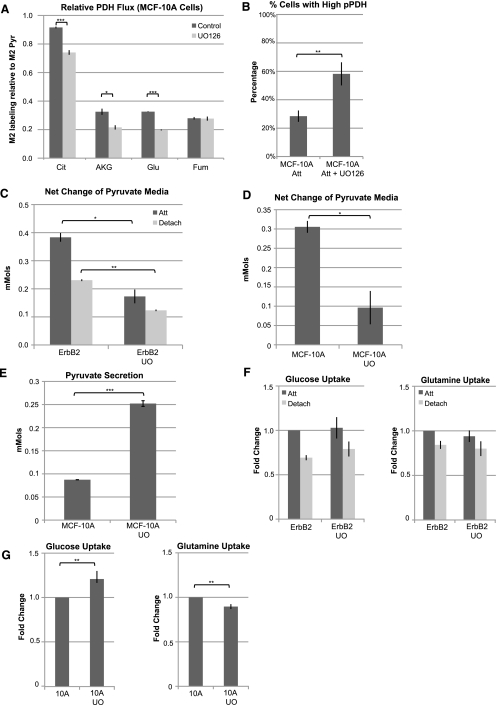
Loss of extracellular matrix (ECM) attachment leads to metabolic impairments that limit cellular energy production. Characterization of the metabolic alterations induced by ECM detachment revealed a dramatic decrease in uptake of glucose, glutamine, and pyruvate, and a consequent decrease in flux through glycolysis, the pentose phosphate pathway, and the tricarboxylic acid (TCA) cycle. However, flux through pyruvate dehydrogenase (PDH) is disproportionally decreased, concomitant with increased expression of the PDH inhibitory kinase, PDH kinase 4 (PDK4), and increased carbon secretion. Overexpression of ErbB2 maintains PDH flux by suppressing PDK4 expression in an Erk-dependent manner, and Erk signaling also regulates PDH flux in ECM-attached cells. Additionally, epidermal growth factor (EGF), a potent inducer of Erk, positively regulates PDH flux through decreased PDK4 expression. Furthermore, overexpression of PDK4 in ECM-detached cells suppresses the ErbB2-mediated rescue of ATP levels, and in attached cells, PDK4 overexpression decreases PDH flux, de novo lipogenesis, and cell proliferation. Mining of microarray data from human tumor data sets revealed that PDK4 mRNA is commonly down-regulated in tumors compared with their tissues of origin. These results identify a novel mechanism by which ECM attachment, growth factors, and oncogenes modulate the metabolic fate of glucose by controlling PDK4 expression and PDH flux to influence proliferation.


Figures

Figure 1.
Figure 1.
Changes in nutrient uptake induced by ECM detachment and ErbB2 overexpression. (A–D) MCF-10A or MCF-10A ErbB2 cells were cultured on control (Att) or polyHEMA-coated plates (Detach) for 24 h. Changes in glucose (A), glutamine (B), pyruvate (C), and lactate (D) medium concentration were normalized to attached MCF-10A cells. Data are presented as an average from three or more independent experiments. (E) Ratio of lactate secretion to glucose uptake. (F) Graphical representation of fluxes determined via MFA or MID data (for oxidative PPP). Arrow thickness indicates level of flux in MCF-10A-attached cells. Color indicates fold difference between detached and attached MCF-10A cells (left panel) or between detached MCF-10A ErbB2 and detached MCF-10A cells (right panel). Gray arrows indicate fluxes not determined. (Akg) α-Ketoglutarate; (Asp) aspartate; (Cit) citrate; (Fum) fumarate; (F6P) fructose-6-phosphate; (Gluc) glucose; (Glu) glutamate; (G6P) glucose-6-phosphate; (Gln) glutamine; (Lac) lactate; (Mal) malate; (Oac) oxaloacetate; (P5P) pentose-5-phosphate; (PEP) phosphoenolpyruvate; (Pyr) pyruvate; (Suc) succinate; (T3P) triose phosphate. See also Supplemental Figure S1 and Supplemental Table S1 for details of MFA model, results, and data.
Figure 2.
Figure 2.
ErbB2 maintains PDH flux in ECM-detached cells. (A, left panel) Carbon atom (represented by circles) transitions and tracers used to detect the changes in PDH flux. Using isotopic label from [1,2-13C2]glucose (black circles). (Right panel) Cells were cultured with [1,2-13C2]glucose as in Figure 1A. Relative PDH flux was estimated by calculating the ratio of M2 citrate (Cit), glutamate (Glu), fumarate (Fum), or aspartate (Asp) normalized to M2 pyruvate labeling, which was determined by GC/MS. Data are representative of three independent experiments. (B) The left panel shows entry of second M2 AcCoA into the TCA cycle. (Right panel) Ratio of M4 citrate or glutamate, or M3 fumarate or aspartate, to M2 pyruvate. Data are representative of three independent experiments. (C,D) PDH (C) and LDH (D) flux estimates and 95% confidence intervals by the 13C MFA model. Data are representative of three independent experiments. (E) Ratio of values in C and D. (F,G) Pyruvate uptake (F) and synthesis/secretion (G) were determined by measuring the concentration of labeled and unlabeled pyruvate in spent medium from cells cultured with [2-13C]pyruvate in triplicate, and average values are presented.
Figure 3.
Figure 3.
PDK4 expression is regulated by ECM attachment and Mek/Erk signaling. (A) MCF-10A cells, or MCF-10A ErbB2 cells treated with 10 μM UO126 (UO) or vehicle, were plated in attached or detached conditions. Twenty-four hours later, mRNA levels for PDK4 were quantified by qPCR. (B) Cells were plated as in A in attached (A) or detached (D) conditions with vehicle control or 10 μM UO126 (UO). Expression or phosphorylation of the indicated proteins was determined by immunoblotting. (C) MCF-10A cells were infected with nontargeting or PDK4-targeting doxycycline-inducible small hairpins (shRNAs). Expression of the shRNA was induced for 48 h with 1 μg/mL doxycycline. Cells were then grown in detached conditions in the presence of 1 μg/mL doxycycline for 24 h. PDK4 mRNA levels were determined by qPCR. Data are presented as fold change relative to MCF-10A-detached cells with nontargeting shRNA. (D) Cells were grown as in C in the presence of [1,2-13C2]glucose for 24 h. Relative PDH flux was estimated by calculating the ratio of M2 citrate (Cit), glutamate (Glu), malate (Mal), or aspartate (Asp) normalized to M2 pyruvate labeling, which was determined by GC/MS. (E) Expression of PDK4 in NMuMG, NMuMG Neu-T (NT), and NMuMG NT2196 cells was determined by qPCR. Data are an average of three independent experiments and are presented as fold change relative to NMuMG cells. (F,G) MCF-10A cells or MCF-10A ErbB2 cells were plated in attached or detached conditions. Twenty-four hours later, the level of pSer293 PDH was determined by flow cytometry. Data are presented as fold change over attached cells, and are an average of three independent experiments (F) or representative of three independent experiments (G). (H) MCF-10A cells treated with 10 μM UO126 (UO) or vehicle were plated and analyzed as in A. Data shown in A and H are presented as average fold increases relative to MCF-10A-attached cells from three independent experiments.
Figure 4.
Figure 4.
Erk signaling regulates pyruvate metabolism. (A) MCF-10A cells treated with vehicle or 10 μM UO126 (UO) were cultured for 24 h in medium with [1,2-13C2]glucose. Relative PDH flux was estimated by calculating the ratio of M2 metabolite labeling to that of pyruvate in triplicate, and average values are presented. (B) MCF-10A cells were plated as in A. Twenty-four hours later, the levels of pSer293 PDH were determined by immunofluorescence. Cells were scored as containing high or low levels of pSer293 PDH staining (colocalizing with the mitochondrial marker cytochrome c). Data are presented as an average of three independent experiments. (C,D) MCF-10A ErbB2-attached (Att) or -detached (Detach) (C) and MCF-10A-attached (D) cells were treated with vehicle or 10 μM UO126 (UO), and pyruvate consumption was determined 24 h later. Data are presented as an average of three independent experiments. (E) MCF-10A-attached cells treated with vehicle or 10 μM UO126 (UO) were cultured with [1,2-13C2]glucose. The concentration of M1 and M2 pyruvate in the spent medium in triplicate was measured by GC/MS and used to assess pyruvate synthesis/secretion; average values are shown. (F,G) MCF-10A ErbB2 (F) and MCF-10A (G) cells treated with vehicle or 10 μM UO126 (UO) were plated on control or polyHEMA plates for 24 h. Changes in medium glucose and glutamine concentration were determined and normalized to vehicle-treated attached cells. Data are presented as an average of more than three independent experiments.
Figure 5.
Figure 5.
Differential regulation of PDK4, PDH flux, and nutrient uptake by insulin and EGF. (A) MCF-10A cells were cultured in the presence (+) or absence (−) of insulin and EGF for 24 h. Expression or phosphorylation of the indicated proteins was determined by immunoblotting. (B) Cells were cultured as in A, and PDK4 mRNA levels were quantified by qPCR. Data are normalized to (+) EGF/insulin conditions and are averages from three independent experiments. (C) MCF-10A cells were plated in the absence or presence of EGF. Twenty-four hours later, the levels of pSer293 PDH were determined by immunofluorescence. Cells were scored as containing high or low levels of pSer293 PDH staining colocalizing with the mitochondrial marker cytochrome c. Data are presented as an average of three independent experiments. (D) Cells were cultured as in A in the presence of [1,2-13C2]glucose. Relative PDH flux was estimated by calculating the ratio of M2 metabolite labeling to that of pyruvate in triplicate, and average values are presented. (E) Cells were cultured as in A, and changes in medium levels of glucose and glutamine were determined. Data are normalized to (+) EGF/insulin conditions, and are averages of three independent experiments. (F) Cells were cultured as in A. Changes in medium concentration of pyruvate were measured by GC/MS. Data represent averages from three independent experiments. (G) Cells were cultured as in D. The concentration of M1 and M2 pyruvate in triplicate samples of spent medium was measured by GC/MS to assess pyruvate synthesis/secretion, and average values are shown. (H) Cells were cultured as in A, and 24 h later, ATP levels were measured using the ATPlite assay. Data are normalized to (+) EGF/insulin conditions, and are an average of three independent experiments.
Figure 6.
Figure 6.
PDK4 regulates glucose entry into the TCA cycle and ATP levels. (A) mRNA levels of PDK4 in MCF-10A or MCF-10A ErbB2 cells infected with control pBABE-IRES-NEO vector (Vector) or pBABE-PDK4-IRES-NEO (PDK4) were quantified by qPCR. Data are normalized to vector control cells from each experiment, and are presented as averages from three independent experiments. (B,C) MCF-10A (B) and MCF-10A ErbB2 (C) cells infected with control vector or pBABE-PDK4-IRES-NEO were plated on control (Att) or polyHEMA-coated (Detach) plates for 24 h in medium containing [1,2-13C2]glucose. Relative PDH flux was estimated by calculating the ratios of M2 metabolite labeling in triplicate, and average values are presented. (D,E) Cells were plated as in B and C, and pyruvate levels in spent medium were quantified by GC/MS. Data are presented as the average of three independent experiments. (F,G) Cells were cultured as in B and C. The concentration of M1 and M2 pyruvate in the spent medium was measured by GC/MS in triplicate and used to assess pyruvate secretion. (H) MCF-10A and MCF-10A ErbB2 cells infected with control vector or pBABE-PDK4-IRES-NEO were plated on control (Att) or polyHEMA-coated (Detach) plates for 24 h, and ATP levels were measured using the ATPlite assay. Data are presented as the ratio of ATP levels in detached cells to ATP levels in attached cells, and are the average of three independent experiments.
Figure 7.
Figure 7.
PDK4 negatively regulates de novo lipogenesis and cell proliferation. (A) MCF-10A or MCF10A ErbB2 cells infected with control vector (Vector) or pBABE-PDK4-IRES-NEO (PDK4) were cultured under attached conditions in the presence of [U-13C6]glucose or [2-13C]pyruvate. Medium was replaced every 24 h. After 4 d, the percentage of newly synthesized palmitate was determined via isotopomer spectral analysis (ISA). Palmitate-labeling data and complete ISA results are listed in Supplemental Table S2. Error bars indicate 95% confidence intervals. (B,C) MCF-10A (B) or MCF10A ErbB2 (C) cells infected with control vector or pBABE-PDK4-IRES-NEO were plated at equal concentration. After 2, 3 or 4 d, cell numbers were determined using a hemocytometer. (D,E) MCF-10A ErbB2 (D) or MCF10A (E) cells infected with control vector or pBABE-PDK4-IRES-NEO were cultured under attached conditions. FACS analysis was performed to determine the percentage of cells in sub-G1, G1, and S/G2. (Left panels) Averages of data from three independent experiments. (Right panels) Representative histograms from one of three independent experiments. (F) mRNA levels for PDK4, p27 (CDKN1B), and p57 (CDKN1C) were extracted from a data set derived from MCF-10A cells cultured in reconstituted basement membrane for 15 d (originally described in Schmelzle et al. 2007). Data represent the average fold change relative to the levels on day 2 from triplicate samples harvested at each of the indicated days.
Figure 8.
Figure 8.
Overexpression of PDK4 suppresses cell proliferation. (A) In MCF-10A cells, PDK4 is a negative regulator of PDH flux. In attached cells plated in the presence of EGF, Erk activity maintains low levels of PDK4 transcription, allowing for entry of glucose carbons into the TCA cycle, and production of ATP and biosynthetic intermediates for lipid, nucleotide, and amino acid synthesis. In MCF-10A-detached cells or -attached cells starved of EGF, Erk activation is decreased, leading to high PDK4 levels, low PDH flux, and increased secretion of lactate, pyruvate, and alanine (dashed arrow). This contributes to the decreases in ATP and proliferation. Ectopic expression of ErbB2, in an Erk-dependent manner, partially prevents the increase in PDK4 levels in the ECM-detached cells, and thus maintains PDH flux and ATP levels. Overexpression of PDK4 decreases PDH flux, leading to a decrease in production of ATP and biosynthetic intermediates from the TCA cycle, which results in decreased de novo lipogenesis and proliferation. The PI3K/Akt pathway regulates nutrient (glucose, glutamine, and pyruvate) uptake. The gray arrow indicates weak activation of Erk by insulin. (AAs) Amino acids; (Ala) alanine; (Cyt) cytoplasm; (Lac) lactate; (Mit) mitochondria; (Nuc) nucleus; (Pyr) pyruvate. (B) Heat map of fold change in PDK4 expression in tumor samples. Data are publicly available on Oncomine, and citations are included as Supplemental Material.

Comment in

  • Metabolic regulation by ERK.
    Huddleston JE. Huddleston JE. Nat Rev Mol Cell Biol. 2011 Aug 23;12(9):546. doi: 10.1038/nrm3179. Nat Rev Mol Cell Biol. 2011. PMID: 21860387 No abstract available.

References

    1. Abbot EL, McCormack JG, Reynet C, Hassall DG, Buchan KW, Yeaman SJ 2005. Diverging regulation of pyruvate dehydrogenase kinase isoform gene expression in cultured human muscle cells. FEBS J 272: 3004–3014 - PubMed
    1. Antoniewicz MR, Kelleher JK, Stephanopoulos G 2006. Determination of confidence intervals of metabolic fluxes estimated from stable isotope measurements. Metab Eng 8: 324–337 - PubMed
    1. Arnaud M, Crouin C, Deon C, Loyaux D, Bertoglio J 2004. Phosphorylation of Grb2-associated binder 2 on serine 623 by ERK MAPK regulates its association with the phosphatase SHP-2 and decreases STAT5 activation. J Immunol 173: 3962–3971 - PubMed
    1. Asada S, Daitoku H, Matsuzaki H, Saito T, Sudo T, Mukai H, Iwashita S, Kako K, Kishi T, Kasuya Y, et al. 2007. Mitogen-activated protein kinases, Erk and p38, phosphorylate and regulate Foxo1. Cell Signal 19: 519–527 - PubMed
    1. Bensaad K, Tsuruta A, Selak MA, Vidal MN, Nakano K, Bartrons R, Gottlieb E, Vousden KH 2006. TIGAR, a p53-inducible regulator of glycolysis and apoptosis. Cell 126: 107–120 - PubMed

Publication types

MeSH terms