

Optical imaging of breast cancer oxyhemoglobin flare correlates with neoadjuvant chemotherapy response one day after starting treatment
- PMID: 21852577
- PMCID: PMC3167535
- DOI: 10.1073/pnas.1013103108
Optical imaging of breast cancer oxyhemoglobin flare correlates with neoadjuvant chemotherapy response one day after starting treatment
Abstract
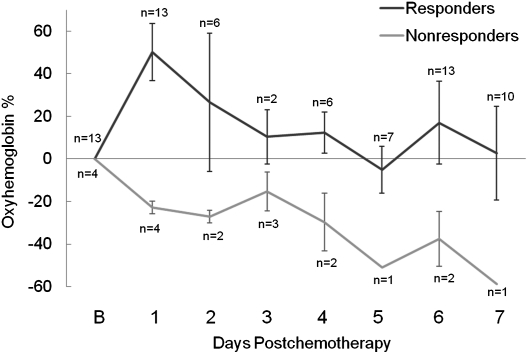
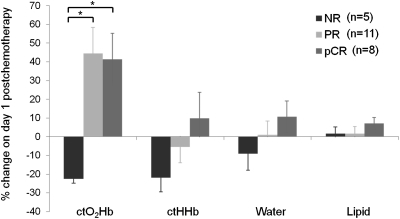
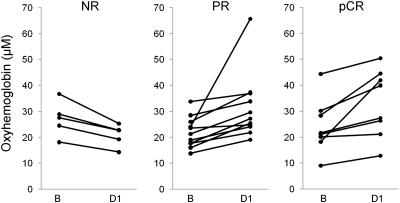
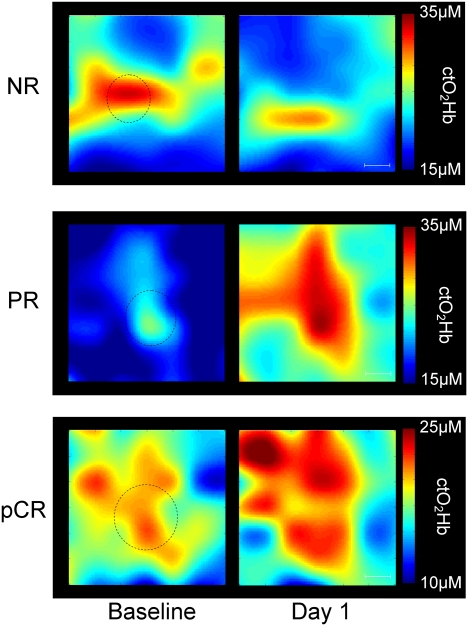
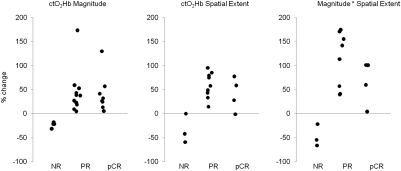
Approximately 8-20% of breast cancer patients receiving neoadjuvant chemotherapy fail to achieve a measurable response and endure toxic side effects without benefit. Most clinical and imaging measures of response are obtained several weeks after the start of therapy. Here, we report that functional hemodynamic and metabolic information acquired using a noninvasive optical imaging method on the first day after neoadjuvant chemotherapy treatment can discriminate nonresponding from responding patients. Diffuse optical spectroscopic imaging was used to measure absolute concentrations of oxyhemoglobin, deoxyhemoglobin, water, and lipid in tumor and normal breast tissue of 24 tumors in 23 patients with untreated primary breast cancer. Measurements were made before chemotherapy, on day 1 after the first infusion, and frequently during the first week of therapy. Various multidrug, multicycle regimens were used to treat patients. Diffuse optical spectroscopic imaging measurements were compared with final postsurgical pathologic response. A statistically significant increase, or flare, in oxyhemoglobin was observed in partial responding (n = 11) and pathologic complete responding tumors (n = 8) on day 1, whereas nonresponders (n = 5) showed no flare and a subsequent decrease in oxyhemoglobin on day 1. Oxyhemoglobin flare on day 1 was adequate to discriminate nonresponding tumors from responding tumors. Very early measures of chemotherapy response are clinically convenient and offer the potential to alter treatment strategies, resulting in improved patient outcomes.
Conflict of interest statement
Conflict of interest statement: B.T. and A.C. report patents, which are owned by the University of California, that are related to the technology and analysis methods described in this study. The diffuse optical spectroscopic imaging instrumentation used in this study was constructed in a university laboratory using federal grant support (National Institutes of Health). The University of California has licensed diffuse optical spectroscopic imaging technology and analysis methods to two companies, FirstScan, Inc. and Volighten, Inc., for different fields of use, including breast cancer (FirstScan, Inc.). This research was completed without participation, knowledge, or financial support of either company, and data were acquired and processed from patients by coauthors unaffiliated with either entity. The Institutional Review Board and Conflict of Interest Office of the University of California, Irvine, have reviewed both patent and corporate disclosures and did not find any concerns.
Figures
References
-
- Kaufmann M, et al. Recommendations from an international expert panel on the use of neoadjuvant (primary) systemic treatment of operable breast cancer: New perspectives 2006. Ann Oncol. 2007;18:1927–1934. - PubMed
-
- Rastogi P, et al. Preoperative chemotherapy: Updates of National Surgical Adjuvant Breast and Bowel Project Protocols B-18 and B-27. J Clin Oncol. 2008;26:778–785. - PubMed
-
- Wolff AC, et al. Research issues affecting preoperative systemic therapy for operable breast cancer. J Clin Oncol. 2008;26:806–813. - PubMed
-
- Gralow JR, et al. Preoperative therapy in invasive breast cancer: Pathologic assessment and systemic therapy issues in operable disease. J Clin Oncol. 2008;26:814–819. - PubMed
-
- Fisher ER, et al. Pathobiology of preoperative chemotherapy: Findings from the National Surgical Adjuvant Breast and Bowel (NSABP) protocol B-18. Cancer. 2002;95:681–695. - PubMed
Publication types
MeSH terms
Substances
Grants and funding
LinkOut - more resources
Full Text Sources
Other Literature Sources
Medical
