. 2011 Oct;60(10):2598-607.
doi: 10.2337/db10-1740. Epub 2011 Aug 18.

GLUT2 accumulation in enterocyte apical and intracellular membranes: a study in morbidly obese human subjects and ob/ob and high fat-fed mice

Affiliations

GLUT2 accumulation in enterocyte apical and intracellular membranes: a study in morbidly obese human subjects and ob/ob and high fat-fed mice

Amal Ait-Omar et al. Diabetes. 2011 Oct.

Abstract

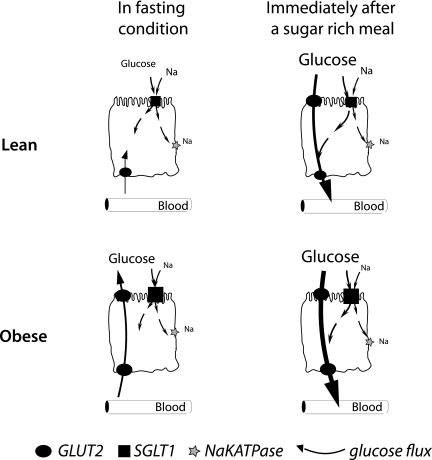
Objective: In healthy rodents, intestinal sugar absorption in response to sugar-rich meals and insulin is regulated by GLUT2 in enterocyte plasma membranes. Loss of insulin action maintains apical GLUT2 location. In human enterocytes, apical GLUT2 location has not been reported but may be revealed under conditions of insulin resistance.

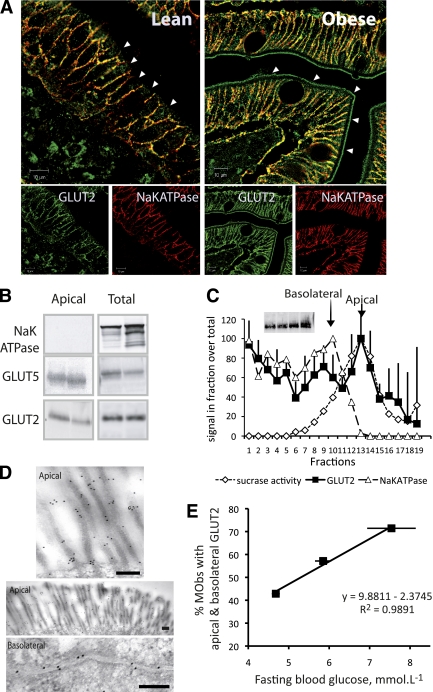
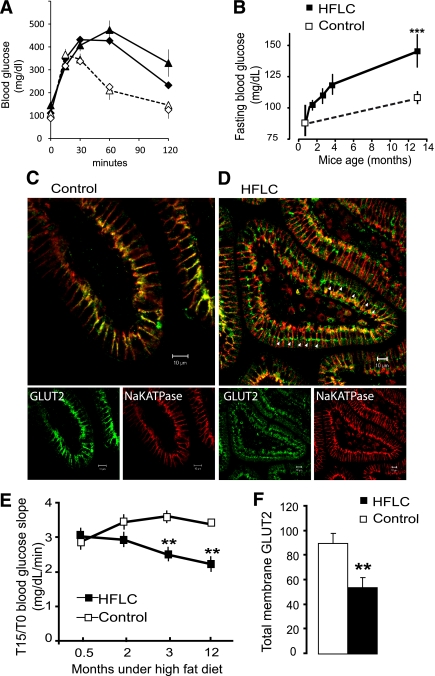
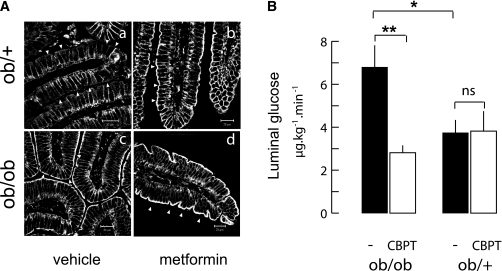
Research design and methods: Subcellular location of GLUT2 in jejunal enterocytes was analyzed by confocal and electron microscopy imaging and Western blot in 62 well-phenotyped morbidly obese subjects and 7 lean human subjects. GLUT2 locations were assayed in ob/ob and ob/+ mice receiving oral metformin or in high-fat low-carbohydrate diet-fed C57Bl/6 mice. Glucose absorption and secretion were respectively estimated by oral glucose tolerance test and secretion of [U-(14)C]-3-O-methyl glucose into lumen.

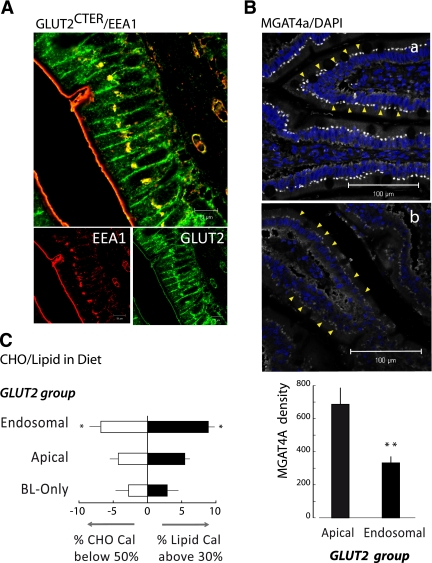
Results: In human enterocytes, GLUT2 was consistently located in basolateral membranes. Apical GLUT2 location was absent in lean subjects but was observed in 76% of obese subjects and correlated with insulin resistance and glycemia. In addition, intracellular accumulation of GLUT2 with early endosome antigen 1 (EEA1) was associated with reduced MGAT4a activity (glycosylation) in 39% of obese subjects on a low-carbohydrate/high-fat diet. Mice on a low-carbohydrate/high-fat diet for 12 months also exhibited endosomal GLUT2 accumulation and reduced glucose absorption. In ob/ob mice, metformin promoted apical GLUT2 and improved glucose homeostasis. Apical GLUT2 in fasting hyperglycemic ob/ob mice tripled glucose release into intestinal lumen.

Conclusions: In morbidly obese insulin-resistant subjects, GLUT2 was accumulated in apical and/or endosomal membranes of enterocytes. Functionally, apical GLUT2 favored and endosomal GLUT2 reduced glucose transepithelial exchanges. Thus, altered GLUT2 locations in enterocytes are a sign of intestinal adaptations to human metabolic pathology.


Figures

FIG. 1.
FIG. 1.
Apical location of GLUT2 in enterocytes from jejunal samples of morbidly obese subjects (MObs). A: Representative confocal microscopy images of the location of GLUT2 (green) in apical membranes and in basolateral membranes colocalizing (yellow) with Na,KATPase (red). Images, representative of 30 obese (right panel) and 7 lean (left panel) subjects, were obtained with 2 antibodies targeting X-loop1 and COOH-terminal peptides of GLUT2 (Supplementary Fig. 1 for details). Arrows indicate apical membrane domains. Scale 10 μm. B: Two representative Western blots of Na,KATPase, GLUT5, and GLUT2 in purified apical and postnuclear membranes (total) from the jejuna of six obese subjects. C: Quantification of GLUT2 (■) in fractions (75/500 μL) obtained from the separation on density gradients of enterocyte membranes analyzed in Western blots. Na,KATPase (Western blot, dashed line, △) and sucrase activity (dotted line, ◇) were used to identify apical and basolateral membrane fractions, respectively. Insert shows a Western blot of GLUT2 inputs. Data represent the average densities obtained for four obese subjects (arbitrary units ± SEM). D: Immuno-gold electron microscopy images of GLUT2 in apical and basolateral membranes of enterocytes. Scale 0.2 μm. E: Linear regression analysis of the percentage of untreated obese subjects exhibiting apical GLUT2 as a function of mean fasting glycemia. Three subject groups were created using the median blood glucose concentration >5.3 or <5.3 mmol/L or in untreated diabetes (R2 = 0.99). (A high-quality digital representation of this figure is available in the online issue.)
FIG. 2.
FIG. 2.
Accumulation of GLUT2 in endosomes in jejunal enterocytes of obese subjects. A: Representative image of the colocation (yellow) of GLUT2 (green) with the endosome marker EEA1 (red). Confocal microscopy images were performed as in Fig. 1 (scale 10 μm). B: Representative images of MGAT4a glycosyltransferase protein expression comparing the jejuna of obese subjects with apical or endosomal GLUT2 accumulation. Immunolabeling and confocal image acquisitions were performed in parallel in apical (a, n = 10) and endosomal (b, n = 10) groups. Yellow arrows identify the location of MGAT4 in the enterocytes. Quantification of MGAT4a density in both types of subjects was measured with the ImageJ software (**P < 0.0041). C: Carbohydrate (CHO) and lipid calories in diets of obese subjects grouped according to GLUT2 location, i.e., only in basolateral membrane (BL-only), in endosomal, or in apical membranes. Data represent the average deviation of calorie content ± SEM (>30% lipid calorie, ■; *P < 0.038) or carbohydrate calorie (<50%, □; *P < 0.043). (A high-quality digital representation of this figure is available in the online issue.)
FIG. 3.
FIG. 3.
Endosomal accumulation of GLUT2 in mice fed a high-fat diet. Mice were fed either the control chow diet (M25, white symbols) or HFLC diet (black symbols) for up to 12 months. A: OGTTs are shown after 2 months (diamonds) and 12 months (triangles) in two groups of eight mice fed the control or HFLC diet. B: Fasting blood glucose concentration increases were measured with time (mg/dL ± SEM; n = 8; ***P < 0.001). C and D: Representative confocal images of GLUT2 (green) and Na,KATPase (red) location in 6-μm sections of control and HFLC jejuna after 12 months. Scale 10 μm. Note the endosomal accumulation of GLUT2 (arrows) and low basolateral GLUT2 in the jejunum of HFLC-fed mice compared with control diet mice. E: Initial slopes (T15/T0) of blood glucose concentration after OGTT (**P < 0.01) estimating sugar absorption. In F, quantification of GLUT2 abundance by Western blot (density arbitrary units ± SEM, **P < 0.01) is shown in postnuclear membrane preparations of control and HFLC jejuna. (A high-quality digital representation of this figure is available in the online issue.)
FIG. 4.
FIG. 4.
Apical GLUT2 increase after metformin treatment and the functional significance in obese mice. A: ob/ob mice fed a standard diet (M25) received either the H2O vehicle or 25 mg/kg metformin twice a day for 10 days. Representative confocal images of GLUT2 location in jejuna from fasted ob/+ (upper row) and ob/ob (lower row) mice after treatment with vehicle (left column) or metformin (right column) are shown. Arrowheads indicate the apical side of enterocytes. Scale 10 μm. B: Release of glucose in the luminal content of freely moving ob/ob and ob/+ mice measured 30 min after an intravenous injection of radioactive 3-OMG tracer. Mice were fasted overnight and received 1 g/kg glucose by intraperitoneal injection. Before tracer injection, half of the mice also received by gavage an oral bolus of ethanolic water (1/1,000, vol/vol) containing cytochalasin B (0.3 mmol/L) and phloretin (1 mmol/L) (CBPT, □) or vehicle (■). Data are expressed as μg ⋅ kg−1 ⋅ min−1 ± SEM. Controls (n = 8) and CBPT (n = 4) per phenotype are shown. *P < 0.05, **P < 0.01.
FIG. 5.
FIG. 5.
Roles of apical GLUT2 in health and metabolic disease glucose absorption and secretion related to apical GLUT2 location in enterocytes depend on the glucose concentration difference between blood and lumen. In fasting lean subjects (first line schemes), glucose fluxes across epithelial cells occur via SGLT1 in the apical membrane and exit via basolateral GLUT2. Immediately after a sugar-rich meal, GLUT2 is rapidly and transiently inserted in apical membranes to increase glucose absorption (thick black arrow), thereby complementing SGLT1 uptake. Obese subjects (second line) are characterized by permanent apical GLUT2. Fasting hyperglycemia can therefore mediate a blood-to-lumen glucose flux, i.e., secretion through enterocytes into the intestinal lumen. In contrast, after a sugar-rich meal, permanent apical GLUT2 instantly provides a large uptake of glucose. This absorption pathway for glucose remains to be measured.

References

    1. Drozdowski L, Thomson AB. Intestinal hormones and growth factors: effects on the small intestine. World J Gastroenterol 2009;15:385–406 - PMC - PubMed
    1. Wright EM, Hirayama BA, Loo DF. Active sugar transport in health and disease. J Intern Med 2007;261:32–43 - PubMed
    1. Chaikomin R, Doran S, Jones KL, et al. Initially more rapid small intestinal glucose delivery increases plasma insulin, GIP, and GLP-1 but does not improve overall glycemia in healthy subjects. Am J Physiol Endocrinol Metab 2005;289:E504–E507 - PubMed
    1. Raybould HE. Nutrient sensing in the gastrointestinal tract: possible role for nutrient transporters. J Physiol Biochem 2008;64:349–356 - PubMed
    1. Burant CF, Takeda J, Brot-Laroche E, Bell GI, Davidson NO. Fructose transporter in human spermatozoa and small intestine is GLUT5. J Biol Chem 1992;267:14523–14526 - PubMed

Publication types

MeSH terms