

Low bone mineral density and its predictors in type 1 diabetic patients evaluated by the classic statistics and artificial neural network analysis
- PMID: 21852680
- PMCID: PMC3177712
- DOI: 10.2337/dc11-0764
Low bone mineral density and its predictors in type 1 diabetic patients evaluated by the classic statistics and artificial neural network analysis
Abstract
Objective: To investigate factors associated with bone mineral density (BMD) in type 1 diabetes by classic statistic and artificial neural networks.
Research design and methods: A total of 175 eugonadal type 1 diabetic patients (age 32.8 ± 8.4 years) and 151 age- and BMI-matched control subjects (age 32.6 ± 4.5 years) were studied. In all subjects, BMI and BMD (as Z score) at the lumbar spine (LS-BMD) and femur (F-BMD) were measured. Daily insulin dose (DID), age at diagnosis, presence of complications, creatinine clearance (ClCr), and HbA(1c) were determined.
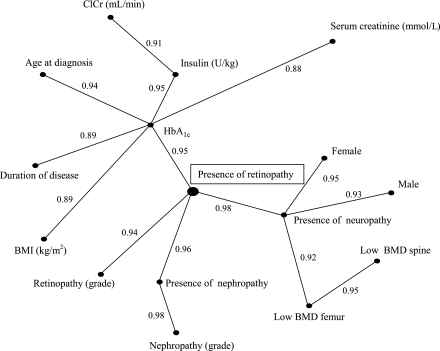
Results: LS- and F-BMD levels were lower in patients (-0.11 ± 1.2 and -0.32 ± 1.4, respectively) than in control subjects (0.59 ± 1, P < 0.0001, and 0.63 ± 1, P < 0.0001, respectively). LS-BMD was independently associated with BMI and DID, whereas F-BMD was associated with BMI and ClCr. The cutoffs for predicting low BMD were as follows: BMI <23.5 kg/m(2), DID >0.67 units/kg, and ClCr <88.8 mL/min. The presence of all of these risk factors had a positive predictive value, and their absence had a negative predictive value for low BMD of 62.9 and 84.2%, respectively. Data were also analyzed using the TWIST system in combination with supervised artificial neural networks and a semantic connectivity map. The TWIST system selected 11 and 12 variables for F-BMD and LS-BMD prediction, which discriminated between high and low BMD with 67 and 66% accuracy, respectively. The connectivity map showed that low BMD at both sites was indirectly connected with HbA(1c) through chronic diabetes complications.
Conclusions: In type 1 diabetes, low BMD is associated with low BMI and low ClCr and high DID. Chronic complications negatively influence BMD.
Figures
References
-
- Vestergaard P. Discrepancies in bone mineral density and fracture risk in patients with type 1 and type 2 diabetes: a meta-analysis. Osteoporos Int 2007;18:427–444 - PubMed
-
- Botolin S, McCabe LR. Chronic hyperglycemia modulates osteoblast gene expression through osmotic and non-osmotic pathways. J Cell Biochem 2006;99:411–424 - PubMed
-
- Coe LM, Irwin R, Lippner D, McCabe LR. The bone marrow microenvironment contributes to type I diabetes induced osteoblast death. J Cell Physiol 2011;226:477–483 - PubMed
-
- Botolin S, McCabe LR. Bone loss and increased bone adiposity in spontaneous and pharmacologically induced diabetic mice. Endocrinology 2007;148:198–205 - PubMed
MeSH terms
Substances
LinkOut - more resources
Full Text Sources
Medical
Miscellaneous
