. 2011 Jul-Aug;12(4):439-49.
doi: 10.3348/kjr.2011.12.4.439. Epub 2011 Jul 22.

Differentiating focal eosinophilic infiltration from metastasis in the liver with gadoxetic acid-enhanced magnetic resonance imaging

Affiliations

Differentiating focal eosinophilic infiltration from metastasis in the liver with gadoxetic acid-enhanced magnetic resonance imaging

Mi Hee Lee et al. Korean J Radiol. 2011 Jul-Aug.

Abstract

Objective: To determine the most useful findings of gadoxetic acid-enhanced 3.0 Tesla (T) MRI for differentiating focal eosinophilic infiltration (FEI) from hepatic metastasis with verification of their usefulness.

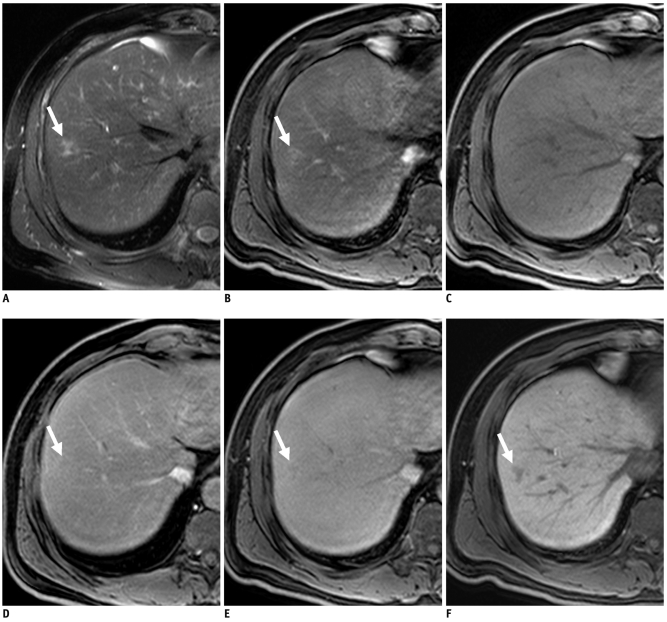
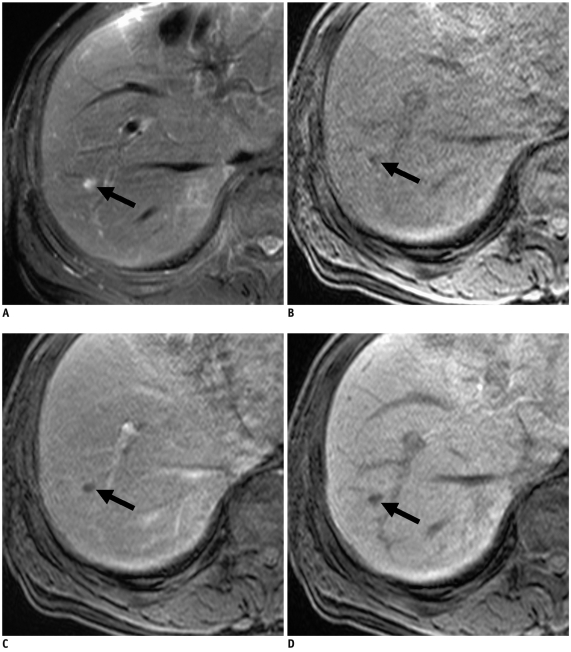
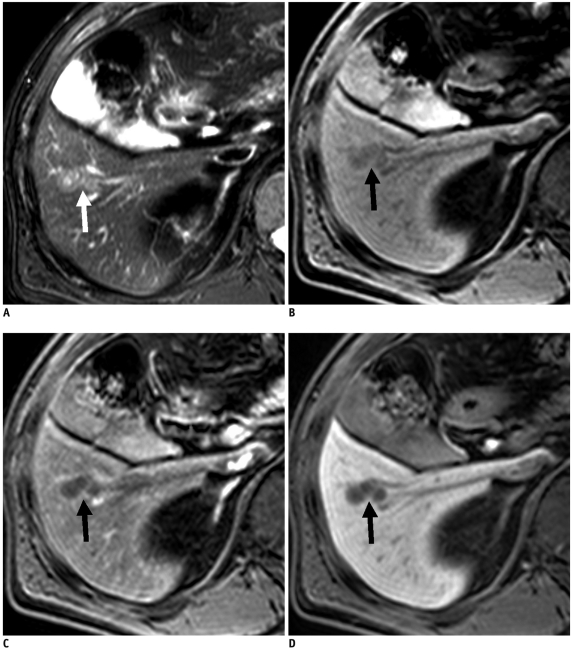
Materials and methods: Pathologically or clinically proven 39 FEIs from 25 patients and 79 hepatic metastases from 51 patients were included in the study. Gadoxetic acid-enhanced 3.0T MRI was performed in all cancer patients. Size differences measured between T2-weighted and hepatobiliary-phase images for lesions > 1 cm and morphologic findings (margin, shape, signal intensity on T1- and T2-weighted images, enhancement pattern on dynamic images, and target appearance on hepatobiliary-phase images) were compared between two groups via Student's t test as well as univariate and multivariate analyses. Diagnostic predictive values of two observers for differentiating two groups were assessed before (session 1) and after (session 2) recognition of results.

Results: Mean size difference (2.1 mm) in FEIs between the two images was significantly greater than for metastases (0.7 mm) (p < 0.05). An ill-defined margin and isointensity on T1-weighted images were independently significant morphologic findings (p < 0.05) for differentiating the two groups. All observers achieved a higher diagnostic accuracy in session 2 (97% and 98%) than session 1 (92% and 89%) with statistical significance in observer 2 (p < 0.05). All observers had significantly higher sensitivities (95%) and negative predictive values (NPVs) (98%) in session 2 than in session 1 (sensitivity, 74% in two observers; NPV, 89% and 88%) (p < 0.05).

Conclusion: With the size change, an ill-defined margin and isointensity on T1-weighted images are the most useful findings for differentiating FEI from hepatic metastasis on gadoxetic acid-enhanced 3.0T MRI.

Keywords: Focal eosinophilic infiltration; Gadoxetic acid-enhanced MRI; Hepatic metastasis.


Figures

Fig. 1
Fig. 1
60-year-old man with gastric adenocarcinoma and focal eosinophilic infiltration (differential count of eosinophils was 18%) in liver. A. T2-weighted image shows non-spherical hyperintense lesion (arrow) in segment VIII. B. Unenhanced T1-weighted image shows isointensity of lesion (arrow). C-E. Gadoxetic acid-enhanced dynamic images show heterogeneous enhancement with slight hyperintensity (arrow) during arterial phase (C) and faint hypointensity (arrow) during portal (D) and 3-minute late phases (E). F. Hepatobiliary phase image obtained 20 minutes after injection of contrast agent shows ill-defined hypointense lesion (arrow) with slight increase in size (13.6 mm on T2-weighted and 14.2 mm on hepatobiliary phase images) compared to A. Lesion spontaneously disappeared on follow-up CT (not shown) taken 6 months later. Lesion was correctly interpreted as focal eosinophilic infiltration on both sessions by all observers.
Fig. 2
Fig. 2
63-year-old man with colon adenocarcinoma and focal eosinophilic abscess, confirmed by biopsy (differential count of eosinophils in peripheral blood, 18%) in liver. A. T2-weighted image shows spherical hyperintense lesion (arrow). B. Unenhanced T1-weighted image shows isointensity of lesion. C-E. Gadoxetic acid-enhanced dynamic images show rim enhancement (arrows) during arterial (C) portal phase (D) and 3-minute late phase (E). F. Hepatobiliary phase image obtained 20 minutes after injection of contrast agent shows well-defined hypointense lesion (arrow). Size difference between T2 (11.9 mm) and hepatobiliary phase (10.5 mm) was 1.4 mm. Slight decrease in size (11.9 mm on T2-weighted and 10.5 mm on hepatobiliary phase images) compared to A. Lesion was correctly interpreted as focal eosinophilic infiltration in session 2 after misinterpretation as metastasis in session 1 by all observers.
Fig. 3
Fig. 3
70-year-old man with rectal cancer and metastatic adenocarcinoma confirmed by intra-operative sonography-guided biopsy in liver (false-positive lesion). A. T2-weighted MR image shows spherical hyperintense lesion (arrow). B. Unenhanced T1-weighted image shows hypointense lesion (arrow). C. Gadoxetic acid-enhanced dynamic image shows no enhancement with hypointensity (arrow) during portal phase or arterial and 3-minute late phases (not shown). D. Hepatobiliary phase image obtained 20 minutes after injection of contrast agent shows well-defined hypointense lesion (arrow) with no change in size compared to A. One of two observers misinterpreted it as focal eosinophilic infiltration in session 2, although it was correctly interpreted as metastasis in session 1.
Fig. 4
Fig. 4
58-year-old man with colon cancer and focal eosinophilic abscess confirmed by percutaneous sonography-guided biopsy (differential count of eosinophils in peripheral blood, 2%) in liver (false-negative lesion). A. T2-weighted image shows non-spherical hypointense lesion (arrow). B. Unenhanced T1-weighted image shows hypointense lesion (arrow). C. Gadoxetic acid-enhanced dynamic images show rim enhancement (arrow) during arterial phase only (C) with hypointensity during portal and 3-minute late phases, without rim enhancement (not shown). D. Hepatobiliary phase image obtained 20 minutes after injection of contrast agent shows well-defined hypointense lesion (arrow). Size difference between T2 (21.5 mm) and hepatobiliary phase (21.3 mm) was 0.2 mm, which is minimal change in size (21.5 mm on T2-weighted and 21.3 mm on hepatobiliary phase images) compared to A. Lesion was misinterpreted as metastasis on both sessions by all observers.

References

    1. Iwasaki K, Torisu M, Fujimura T. Malignant tumor and eosinophils. I. Prognostic significance in gastric cancer. Cancer. 1986;58:1321–1327. - PubMed
    1. Kim GB, Kwon JH, Kang DS. Hypereosinophilic syndrome: imaging findings in patients with hepatic involvement. AJR Am J Roentgenol. 1993;161:577–580. - PubMed
    1. Yoon IL. The eosinophil and gastrointestinal carcinoma. Am J Surg. 1959;97:195–200. - PubMed
    1. Hong SW, Kim HG, Park CI, Lee SI. Eosinophilic liver abscess in patients with gastric carcinoma. Korean J Pathol. 1993;27:27–33.
    1. Won JH, Kim MJ, Kim BM, Ji H, Chung JJ, Yoo HS, et al. Focal eosinophilic infiltration of the liver: a mimick of hepatic metastasis. Abdom Imaging. 1999;24:369–372. - PubMed