. 2011 Aug;7(8):e1002152.
doi: 10.1371/journal.pcbi.1002152. Epub 2011 Aug 11.

Structure and dynamics of the membrane-bound cytochrome P450 2C9

Affiliations

Structure and dynamics of the membrane-bound cytochrome P450 2C9

Vlad Cojocaru et al. PLoS Comput Biol. 2011 Aug.

Abstract

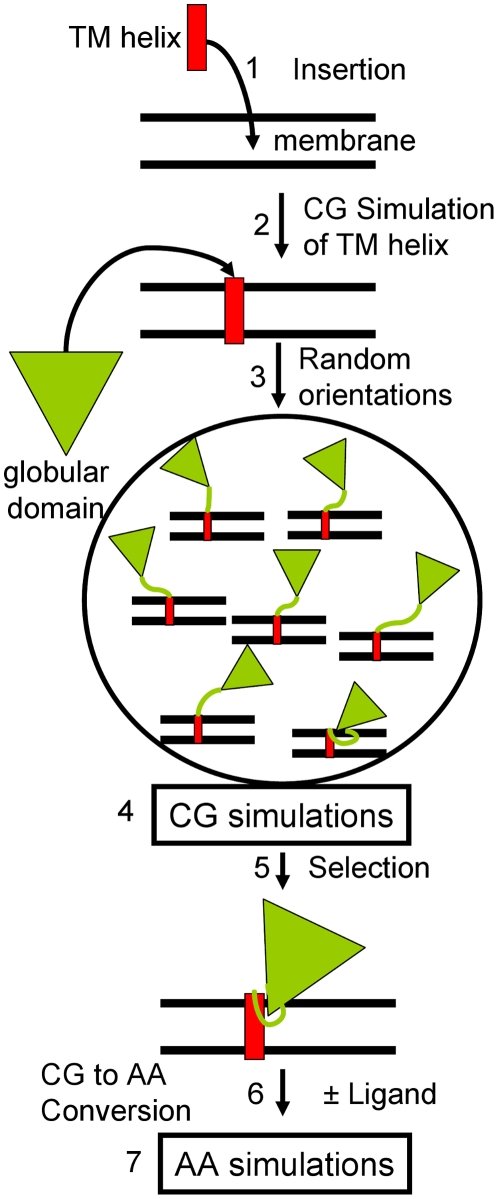
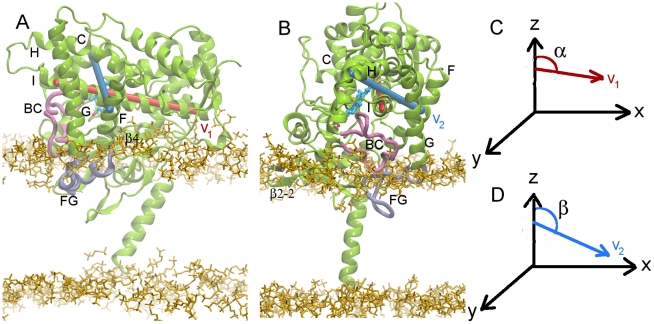
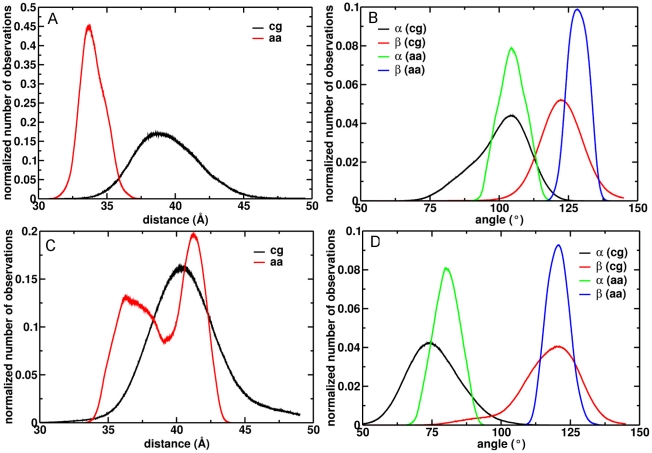
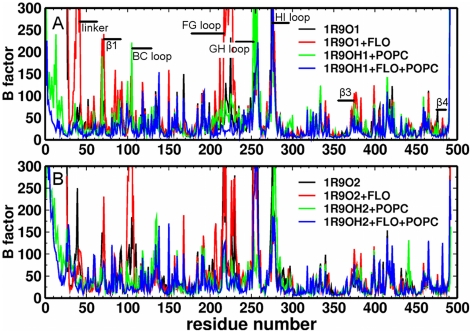
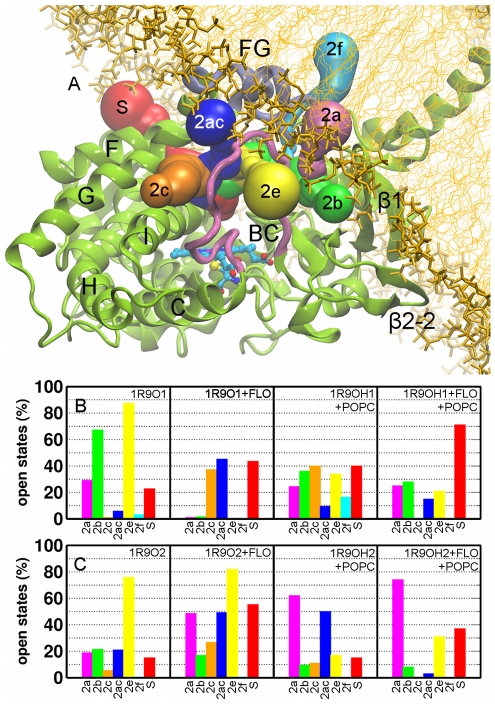
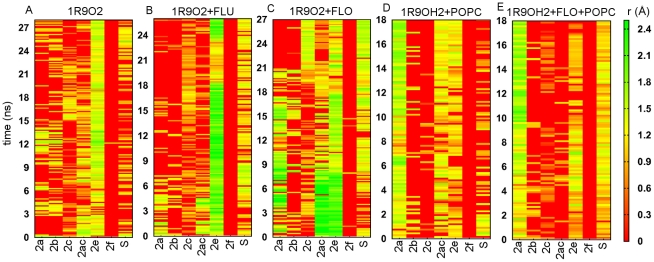
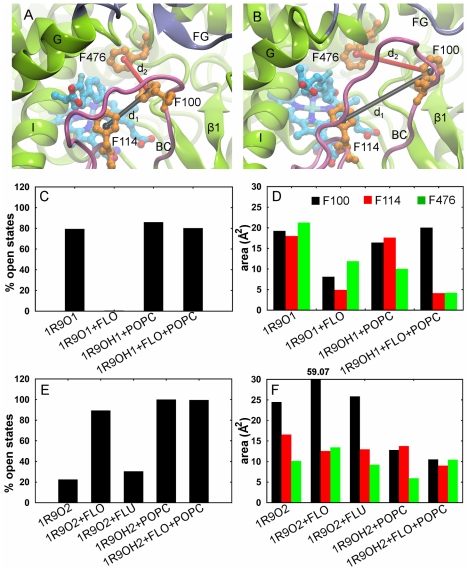
The microsomal, membrane-bound, human cytochrome P450 (CYP) 2C9 is a liver-specific monooxygenase essential for drug metabolism. CYPs require electron transfer from the membrane-bound CYP reductase (CPR) for catalysis. The structural details and functional relevance of the CYP-membrane interaction are not understood. From multiple coarse grained molecular simulations started with arbitrary configurations of protein-membrane complexes, we found two predominant orientations of CYP2C9 in the membrane, both consistent with experiments and conserved in atomic-resolution simulations. The dynamics of membrane-bound and soluble CYP2C9 revealed correlations between opening and closing of different tunnels from the enzyme's buried active site. The membrane facilitated the opening of a tunnel leading into it by stabilizing the open state of an internal aromatic gate. Other tunnels opened selectively in the simulations of product-bound CYP2C9. We propose that the membrane promotes binding of liposoluble substrates by stabilizing protein conformations with an open access tunnel and provide evidence for selective substrate access and product release routes in mammalian CYPs. The models derived here are suitable for extension to incorporate other CYPs for oligomerization studies or the CYP reductase for studies of the electron transfer mechanism, whereas the modeling procedure is generally applicable to study proteins anchored in the bilayer by a single transmembrane helix.


Conflict of interest statement

The authors have declared that no competing interests exist.

Figures

Figure 1
Figure 1. Procedure to model and simulate the membrane-bound CYP2C9.
(1) The transmembrane N-terminal helix (red rectangle) was inserted in a lipid bilayer; (2) The system was simulated for 2 µs with a coarse grained force field for proteins and lipids; (3) The globular domain of CYP2C9 (green triangle) was added in different orientations by randomly changing dihedral angles in the linker peptide; (4) 1 µs of coarse grained simulation was performed for each model; (5) From the analysis of the CYP2C9 orientation in the membrane during the coarse grained simulations, protein-membrane configurations were selected, converted to atomic resolution (6) and used in follow-up atomic-resolution simulations (7).
Figure 2
Figure 2. Models of membrane-bound CYP2C9.
(A) The 1R9OH1 model with the F' and G' helices in the FG loop. (B) The 1R9OH2 model with the FG loop unstructured. In order to define the orientation of the protein in the membrane, the complex was positioned with the membrane in the xy plane and vectors v1 and v2 were defined as follows: v1 (red): along the I helix, connecting the centers of the first and last helical turns in helix I defined by the midpoints of the Cα atoms of residues 285–289 and 312–316 respectively, and v2 (blue), orthogonal to v1, connecting one helical turn in helix C and one in helix F, i.e. the midpoints of the Cα atoms of residues 127–131 and 197–201, respectively. The orientation of CYP2C9 in the membrane was defined by the angles α (C) and β (D) between v1 and v2 and the z axis. The protein is shown in green cartoon representation with the FG and BC loops highlighted in cyan and mauve respectively. The heme is shown in a stick representation colored by atom type. The secondary structure is labeled as follows: helices with letters, strands with numbers, and loops with the labels of the 2 adjacent helices or sheets. The lipid head groups are shown in yellow. These protein and lipid representations are used throughout this manuscript.
Figure 3
Figure 3. Predominant orientations of CYP2C9 in the membrane.
The projection of the distance between the protein and membrane centers of mass on the z axis is shown for the 1R9OH1 (A) and 1R9OH2 (C) models during the coarse grained (black) and atomic-resolution simulations (red). The angles α and β that define the protein orientation in the membrane (Fig. 2) are shown for the 1R9OH1 (B) and 1R9OH2 (D) models during the coarse grained (black and red) and atomic-resolution (green and blue) simulations.
Figure 4
Figure 4. CYP2C9 flexibility.
The average B factors (mean squared atomic positional fluctuations multiplied by 8π2/3) in Å2 during the atomic-resolution simulations of models are plotted for each residue: soluble 1R9O1 (A, black and red), membrane-bound 1R9OH1 (A, green and blue), soluble 1R9O2 (B, black and red), and membrane-bound1R9OH2 (B, green and blue) (in each case, with and without product (FLO) bound).
Figure 5
Figure 5. Tunnels from the CYP2C9 buried active site to the protein surface.
(A) Cartoon representation of all tunnels that were observed to open during the atomic-resolution simulations, labeled according to the nomenclature of Cojocaru et al. . The percentage of trajectory frames in which different channels were open (the smallest radius along the tunnel >1.2 Å) is shown for the models 1R9O1, 1R9OH1 (B), and 1R9O2, 1R9OH2 (C). The colors of the bars correspond to the colors assigned to each tunnel in (A).
Figure 6
Figure 6. Correlation between the opening and closing of different tunnels during the simulations.
The smallest radius along each tunnel is plotted during the atomic-resolution simulations of membrane-bound (1R9OH2) and soluble (1R9O2) CYP2C9. (A) The apo form of 1R9O2. (B) 1R9O2 with bound substrate (flurbiprofen (FLU)). (C) 1R9O2 with bound product (4-hydroxy-flurbiprofen (FLO)). (D) The apo form of 1R9OH2. (E) 1R9OH2 with bound product (FLO). The color map ranges from closed (red to dark yellow) to open tunnels (light yellow to green).
Figure 7
Figure 7. Conformational states of the internal aromatic gate formed by F100, F114 and F476.
(A) Closed. (B) Open. The distances between the centers of the phenyl rings (d1: F100–F114 (black), d2: F100–F476 (red)) define the conformational state of the gate. The gate was considered open if d2>7 Å while d1 was used to define the position of F100 with respect to the other phenylalanines. (C, E) The percentages of trajectory frames in which the gate is open in the atomic-resolution simulations of models 1R9O1, 1R9OH1 (C) and 1R9O2, 1R9OH2 (E). (D, F) The area covered by the centers of the phenyl rings projected on the heme plane (see Fig. S10 for details) in the atomic-resolution simulations of models 1R9O1, 1R9OH1 (D) and 1R9O2, 1R9OH2 (F).

References

    1. Guengerich FP. Cytochrome P450 and chemical toxicology. Chem Res Toxicol. 2008;21:70–83. - PubMed
    1. Black SD, Martin ST, Smith CA. Membrane topology of liver microsomal cytochrome P450 2B4 determined via monoclonal antibodies directed to the halt-transfer signal. Biochemistry. 1994;33:6945–6951. - PubMed
    1. Strobel HW, Lu AY, Heidema J, Coon MJ. Phosphatidylcholine requirement in the enzymatic reduction of hemoprotein P-450 and in fatty acid, hydrocarbon, and drug hydroxylation. J Biol Chem. 1970;245:4851–4854. - PubMed
    1. Nath A, Grinkova YV, Sligar SG, Atkins WM. Ligand binding to cytochrome P450 3A4 in phospholipid bilayer nanodiscs: the effect of model membranes. J Biol Chem. 2007;282:28309–28320. - PubMed
    1. Das A, Sligar SG. Modulation of the cytochrome P450 reductase redox potential by the phospholipid bilayer. Biochemistry. 2009;48:12104–12112. - PMC - PubMed

Publication types

Substances

LinkOut - more resources