. 2011 Aug;7(8):e1002228.
doi: 10.1371/journal.pgen.1002228. Epub 2011 Aug 11.

Analysis of DNA methylation in a three-generation family reveals widespread genetic influence on epigenetic regulation

Affiliations

Analysis of DNA methylation in a three-generation family reveals widespread genetic influence on epigenetic regulation

Jason Gertz et al. PLoS Genet. 2011 Aug.

Abstract

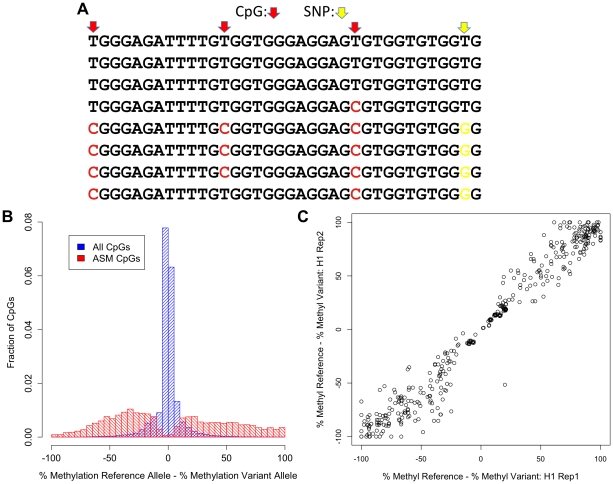
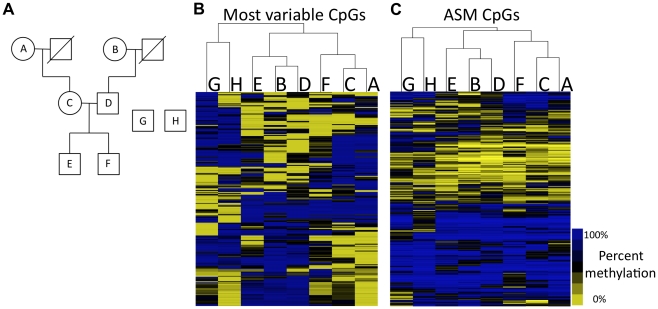
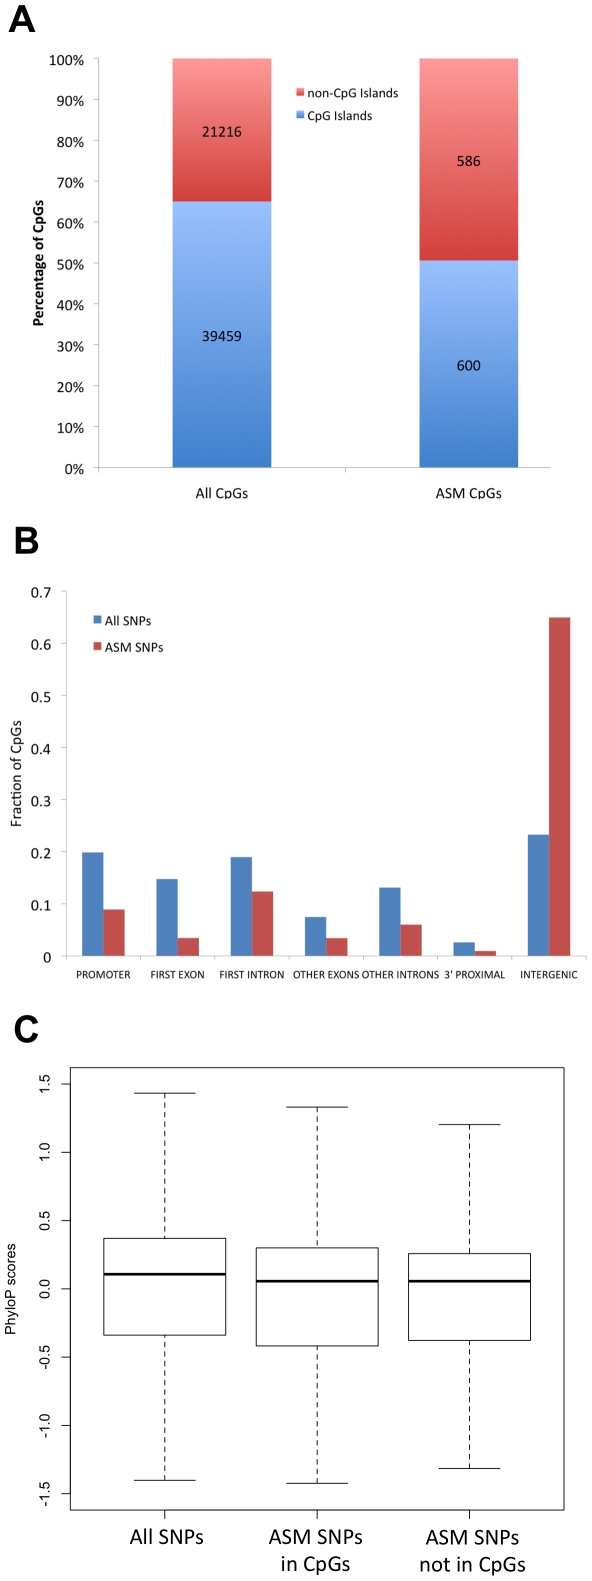
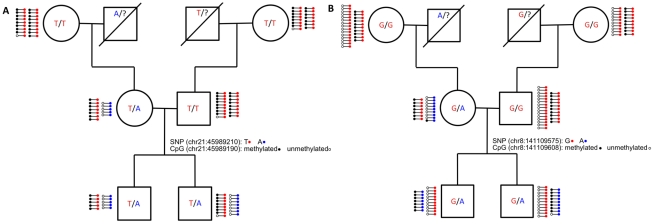
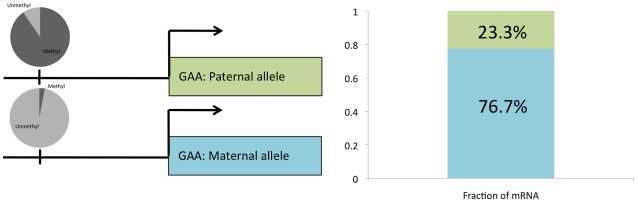
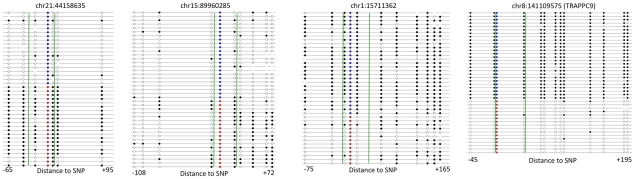
The methylation of cytosines in CpG dinucleotides is essential for cellular differentiation and the progression of many cancers, and it plays an important role in gametic imprinting. To assess variation and inheritance of genome-wide patterns of DNA methylation simultaneously in humans, we applied reduced representation bisulfite sequencing (RRBS) to somatic DNA from six members of a three-generation family. We observed that 8.1% of heterozygous SNPs are associated with differential methylation in cis, which provides a robust signature for Mendelian transmission and relatedness. The vast majority of differential methylation between homologous chromosomes (>92%) occurs on a particular haplotype as opposed to being associated with the gender of the parent of origin, indicating that genotype affects DNA methylation of far more loci than does gametic imprinting. We found that 75% of genotype-dependent differential methylation events in the family are also seen in unrelated individuals and that overall genotype can explain 80% of the variation in DNA methylation. These events are under-represented in CpG islands, enriched in intergenic regions, and located in regions of low evolutionary conservation. Even though they are generally not in functionally constrained regions, 22% (twice as many as expected by chance) of genes harboring genotype-dependent DNA methylation exhibited allele-specific gene expression as measured by RNA-seq of a lymphoblastoid cell line, indicating that some of these events are associated with gene expression differences. Overall, our results demonstrate that the influence of genotype on patterns of DNA methylation is widespread in the genome and greatly exceeds the influence of imprinting on genome-wide methylation patterns.


Conflict of interest statement

The authors have declared that no competing interests exist.

Figures

Figure 1
Figure 1. Discovery of ASM by reduced representation bisulfite sequencing.
(A) Example of bisulfite sequencing reads from a region with a SNP (T/G; yellow) that is associated with methylation levels. Methylated cytosines, which appear as C's in the bisulfite reads, are shown in red. (B) Distribution of the difference in percent methylation of the reference allele and the variant allele is shown for all CpGs that are nearby a SNP (blue) and ASM CpGs that do not involve CpG-disrupting SNPs (red). (C) The difference in percent methylation of the reference allele and the variant allele for ASM events not involving a CpG-disrupting SNP from two biological replicates of the hESC H1 line.
Figure 2
Figure 2. Methylation patterns recapitulate family relationships.
(A) Pedigree is shown for family members analyzed (A–F) as well as unrelated individuals G and H. (B) Hierarchical clustering of the most variable CpGs across all of the individuals. (C) Hierarchical clustering of CpGs that exhibit ASM in at least one individual. Letters at the top of each cluster refer to letters in the pedigree.
Figure 3
Figure 3. ASM is often found in regions that are outside of CpG islands, away from genes, and that exhibit low evolutionary conservation.
(A) The percentage of CpGs found in CpG islands is shown for all CpGs and ASM CpGs. (B) The distribution of genomic locations with respect to genes is shown for all CpGs (blue) and ASM CpGs (red). (C) The distribution of evolutionary conservation scores (phyloP) for intergenic SNPs is shown as a boxplot for all SNPs near CpGs, ASM SNPs in which a SNP mutates a CpG, and ASM SNPs in which a SNP does not mutate a CpG. The midline represents the median conservation score and the box represents the 25% and 75% quantiles.
Figure 4
Figure 4. Inheritance of ASM in the family.
The pedigree of the family is shown with their allele status at (A) chromosome 21 position 45,989,210, which is in an intron of c21orf29, and (B) chromosome 8 position 141,109,575, which is in an intron of TRAPPC9. Next to the assayed individuals, each line with two dots on the ends represents 5 sequence reads. The dot on the left side of each line represents the methylation status of the nearby CpG (black: methylated; white: unmethylated). The dot on the right side of the each line represents the allele status of the SNP (blue: reference allele and red: variant allele).
Figure 5
Figure 5. Allele-specific gene expression overlaps with ASM.
Methylation of upstream CpG on each allele is shown in a pie chart with dark gray representing the fraction of CpG sites that is methylated and light gray representing the fraction unmethylated (left side). The fraction of mRNA that comes from each allele is shown for GAA (right side).
Figure 6
Figure 6. ASM extends past regions assayed by RRBS.
Results from Sanger sequencing of bisulfite PCR clones are shown for four loci where the chromosomal location indicates the position of the SNP. Each line represents one read where black circles represent methylated CpGs, white circles represent unmethylated CpGs, blue circles represent the reference allele and red circles represent the variant allele. Green lines demarcate the region assayed by RRBS. The distance from the SNP to the boundaries of the region is shown below each loci.

References

    1. Okano M, Bell DW, Haber DA, Li E. DNA methyltransferases Dnmt3a and Dnmt3b are essential for de novo methylation and mammalian development. Cell. 1999;99:247–257. - PubMed
    1. Feinberg AP, Tycko B. The history of cancer epigenetics. Nat Rev Cancer. 2004;4:143–153. - PubMed
    1. Jones PA. DNA methylation and cancer. Oncogene. 2002;21:5358–5360. - PubMed
    1. Mill J, Tang T, Kaminsky Z, Khare T, Yazdanpanah S, et al. Epigenomic profiling reveals DNA-methylation changes associated with major psychosis. Am J Hum Genet. 2008;82:696–711. - PMC - PubMed
    1. Richardson B. DNA methylation and autoimmune disease. Clin Immunol. 2003;109:72–79. - PubMed

Publication types