. 2011 Jul 27:2:41.
doi: 10.3389/fphar.2011.00041. eCollection 2011.

Paraoxonase (PON1 and PON3) Polymorphisms: Impact on Liver Expression and Atorvastatin-Lactone Hydrolysis

Affiliations

Paraoxonase (PON1 and PON3) Polymorphisms: Impact on Liver Expression and Atorvastatin-Lactone Hydrolysis

Stephan Riedmaier et al. Front Pharmacol. .

Abstract

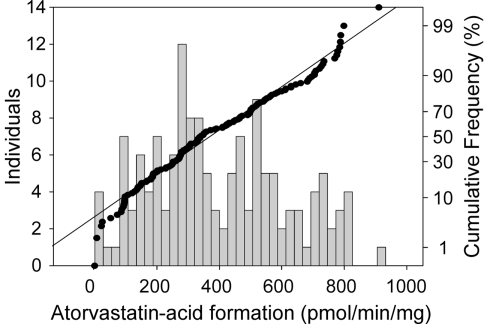
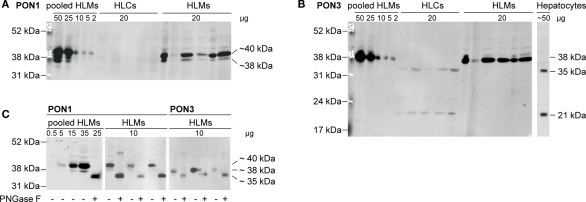
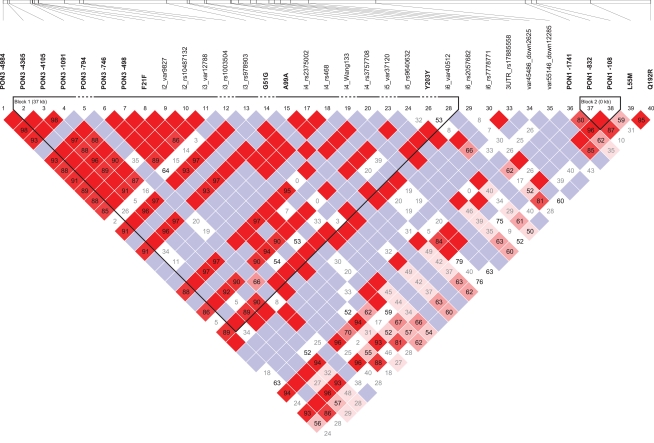
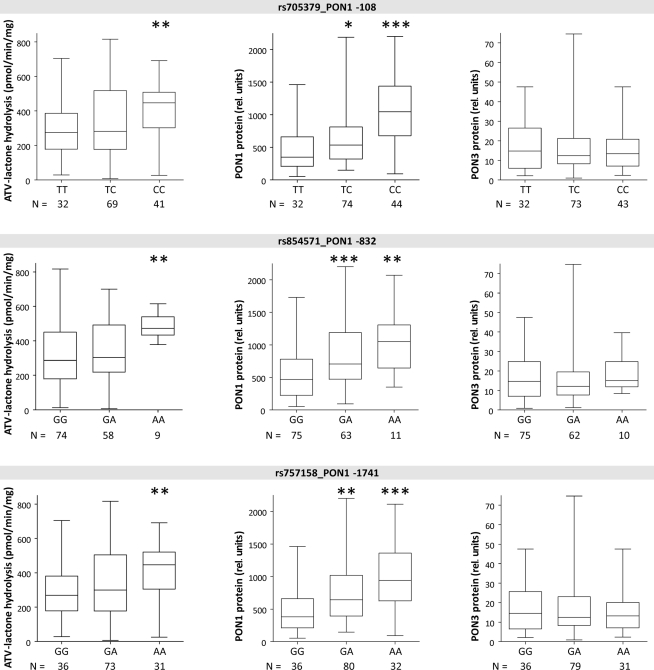
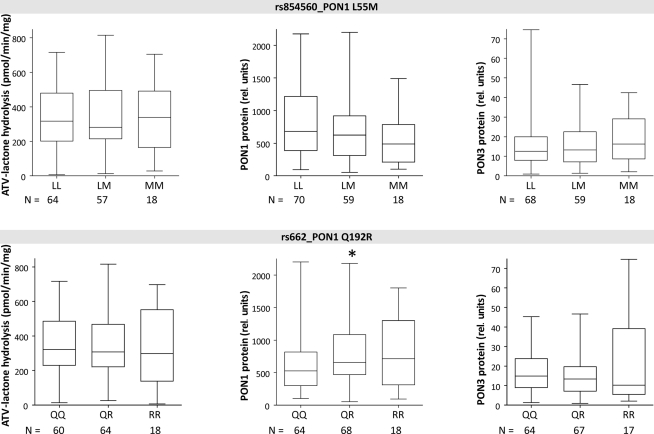
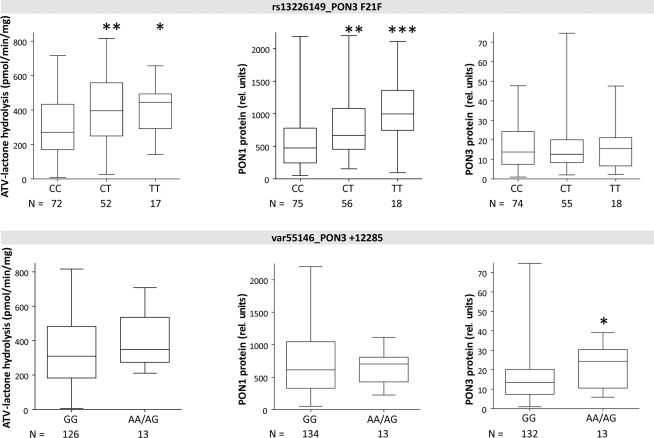
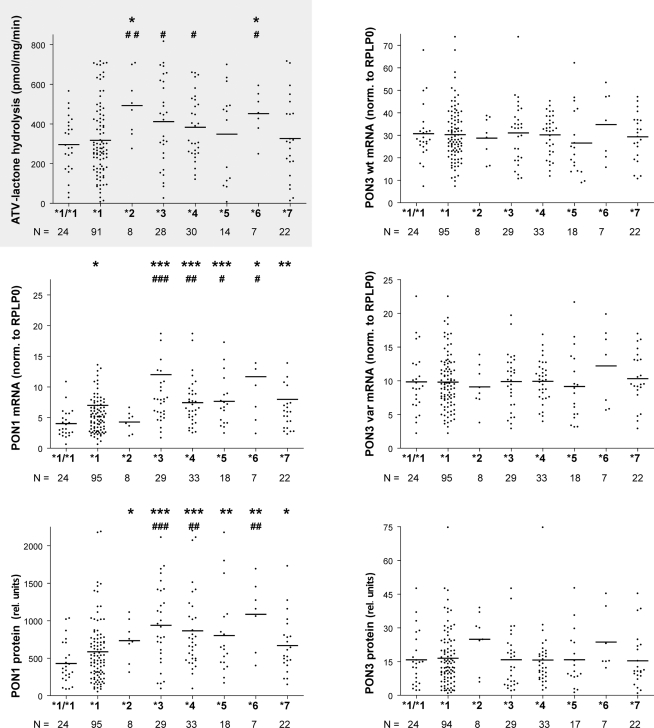
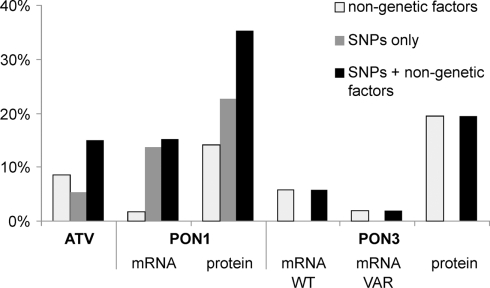
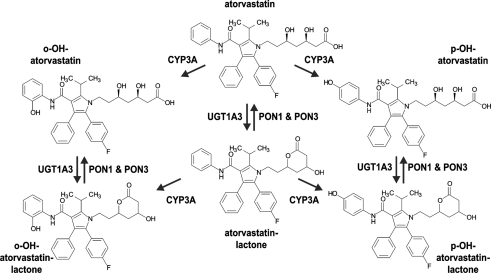
Atorvastatin δ-lactone, a major, pharmacologically inactive metabolite, has been associated with toxicity. In a previous study we showed that polymorphisms of UGT1A3 influence atorvastatin δ-lactone formation. Here we investigated the reverse reaction, atorvastatin δ-lactone hydrolysis, in a human liver bank. Screening of microarray data revealed paraoxonases PON1 and PON3 among 17 candidate esterases. Microsomal δ-lactone hydrolysis was significantly correlated to PON1 and PON3 protein (r(s) = 0.60; r(s) = 0.62, respectively; P < 0.0001). PON1 and PON3 were strongly correlated to each other (r(s) = 0.60) but PON1 was shown to be more extensively glycosylated than PON3. In addition a novel splice-variant of PON3 was identified. Genotyping of 40 polymorphisms within the PON-locus identified PON1 promoter polymorphisms (-108T > C, -832G > A, -1741G > A) and a tightly linked group of PON3 polymorphisms (-4984A > G, -4105G > A, -1091A > G, -746C > T, and F21F) to be associated with changes in atorvastatin δ-lactone hydrolysis and expression of PON1 but not PON3. However, carriers of the common PON1 polymorphisms L55M or Q192R showed no difference in δ-lactone hydrolysis or PON expression. Haplotype analysis revealed decreased δ-lactone hydrolysis in carriers of the most common haplotype *1 compared to carriers of haplotypes *2, *3, *4, and *7. Analysis of non-genetic factors showed association of hepatocellular and cholangiocellular carcinoma with decreased PON1 and PON3 expression, respectively. Increased C-reactive protein and γ-glutamyl transferase levels were associated with decreased protein expression of both enzymes, and increased bilirubin levels, cholestasis, and presurgical exposure to omeprazole or pantoprazole were related to decreased PON3 protein. In conclusion, PON-locus polymorphisms affect PON1 expression whereas non-genetic factors have an effect on PON1 and PON3 expression. This may influence response to therapy or adverse events in statin treatment.

Keywords: PON1; PON3; SNP; atorvastatin-lactone; myopathy; paraoxonase; pharmacogenetics; rhabdomyolysis.


Figures

Figure 1
Figure 1
Frequency histogram (left axis) and cumulative frequency (right axis) showing population distribution of the hydrolysis of atorvastatin-lactone (10 μM) to atorvastatin-acid in human liver microsomes (N = 142). Incubations (5 μg of microsomal protein) were performed in the presence of 1 mM CaCl at 37°C for 30 min. Atorvastatin-acid was quantitated by LC–MS/MS analysis.
Figure 2
Figure 2
Immunoblots of human liver cytosol (HLCs) and microsomes (HLMs) of livers 1–5 stained with specific antibodies against (A) PON1 and (B) PON3 (performed on identical blot after stripping). Analysis was performed on cytosolic and microsomal fractions of livers 1–5, on a human liver microsome pool (lane 11) and on lysate of primary human hepatocytes. (C) Deglycosylation was performed by analysis with (+) or without (−) pretreatment by endoglycosidase PNGase F.
Figure 3
Figure 3
Pairwise linkage disequilibrium is shown for the 40 polymorphisms genotyped in this study. The map was generated using Haploview 4.2. Numbers represent D′ values. D′ = 1: bright red (LOD > 2) or blue (LOD < 2); D′ < 1: shades of pink (LOD > 2) or white (LOD < 2).
Figure 4
Figure 4
Boxplots of PON1 and PON3 protein expression and microsomal atorvastatin-lactone hydrolysis in liver microsomes for indicated polymorphisms. Heterozygotes and homozygotes of variant allele are compared with homozygotes of reference allele by Wilcoxon–Mann– Whitney-tests significance levels are indicated for P < 0.05 (*), P < 0.01 (**), and P < 0.001 (***).
Figure 5
Figure 5
Boxplots of PON1 and PON3 protein expression and microsomal atorvastatin-lactone hydrolysis in liver microsomes for indicated polymorphisms. Heterozygotes and homozygotes of variant allele are compared with homozygotes of reference allele by Wilcoxon–Mann– Whitney-tests significance levels are indicated for P < 0.05 (*), P < 0.01 (**), and P < 0.001 (***).
Figure 6
Figure 6
Boxplots of PON1 and PON3 protein expression and microsomal atorvastatin-lactone hydrolysis in liver microsomes for indicated polymorphisms. Heterozygotes and homozygotes of variant allele are compared with homozygotes of reference allele by Wilcoxon–Mann– Whitney-tests significance levels are indicated for P < 0.05 (*), P < 0.01 (**), and P < 0.001 (***).
Figure 7
Figure 7
PON-locus haplotype–phenotype relationships in human liver. Atorvastatin-lactone hydrolysis, PON1 and PON3 mRNA and microsomal protein are displayed for the indicated haplotypes. Horizontal lines indicate the median. Wilcoxon–Mann–Whitney-tests were applied to compare *2 to *7 carriers with *1/*1 (marked by *) or *1 carriers (marked by #). Significance levels not adjusted for multiple testing are indicated for P < 0.05 (* or #), P < 0.01 (** or ##), and P < 0.001 (*** or ###). After adjusting for multiple testing *3, *4,*5,*7 against *1/*1 or *3 and*4 against *1 were significantly different on PON1 mRNA level and *2 to *7 against *1/*1 or *3, *4, and *6 against *1 were significantly different on PON1 protein level.
Figure 8
Figure 8
Percentage of total atorvastatin-lactone hydrolysis, PON1, and PON3 expression variation explained by multivariate linear models containing only non-genetic factors (white), only genetic factors (gray), or both (black). The bars indicate the coefficient of determination adjusted for the number of factors in the different models. Linear models were derived by step-wise model selection procedure using Akaike’s information criterion.
Figure 9
Figure 9
Proposed pathway for the metabolism of atorvastatin in human liver including Hydroxylation by CYP3A enzymes, Lactonization by UGT1A3, and Hydrolysis of Lactones by PON1 and PON3.

Similar articles

Cited by

References

    1. André S., Kozár T., Kojima S., Unverzagt C., Gabius H.-J. (2009). From structural to functional glycomics: core substitutions as molecular switches for shape and lectin affinity of N-glycans. Biol. Chem. 390, 557–56510.1515/BC.2009.072 - DOI - PubMed
    1. Aragones G., Guardiola M., Barreda M., Marsillach J., Beltran-Debon R., Rull A., Mackness B., Mackness M., Joven J., Simo J. M., Camps J. (2011). Measurement of serum paraoxonase-3 concentration: method evaluation, reference values and influence of genotypes in a population-based study. J. Lipid Res. 52, 1055–106110.1194/jlr.D014134 - DOI - PMC - PubMed
    1. Araoud M., Neffeti F., Douki W., Najjar M. F., Kenani A. (2010). Paraoxonase 1 correlates with butyrylcholinesterase and gamma glutamyl transferase in workers chronically exposed to pesticides. J. Occup. Health 52, 383–38810.1539/joh.O10017 - DOI - PubMed
    1. Baer A. N., Wortmann R. L. (2007). Myotoxicity associated with lipid-lowering drugs. Curr. Opin. Rheumatol. 19, 67–73 - PubMed
    1. Banerjee I. (2010). Relationship between paraoxonase 1 (PON1) gene polymorphisms and susceptibility of stroke: a meta-analysis. Eur. J. Epidemiol. 25, 449–45810.1007/s10654-010-9470-4 - DOI - PubMed