. 2011;6(8):e22075.
doi: 10.1371/journal.pone.0022075. Epub 2011 Aug 10.

A bayesian method for evaluating and discovering disease loci associations

Affiliations

A bayesian method for evaluating and discovering disease loci associations

Xia Jiang et al. PLoS One. 2011.

Abstract

Background: A genome-wide association study (GWAS) typically involves examining representative SNPs in individuals from some population. A GWAS data set can concern a million SNPs and may soon concern billions. Researchers investigate the association of each SNP individually with a disease, and it is becoming increasingly commonplace to also analyze multi-SNP associations. Techniques for handling so many hypotheses include the Bonferroni correction and recently developed bayesian methods. These methods can encounter problems. Most importantly, they are not applicable to a complex multi-locus hypothesis which has several competing hypotheses rather than only a null hypothesis. A method that computes the posterior probability of complex hypotheses is a pressing need.

Methodology/findings: We introduce the bayesian network posterior probability (BNPP) method which addresses the difficulties. The method represents the relationship between a disease and SNPs using a directed acyclic graph (DAG) model, and computes the likelihood of such models using a bayesian network scoring criterion. The posterior probability of a hypothesis is computed based on the likelihoods of all competing hypotheses. The BNPP can not only be used to evaluate a hypothesis that has previously been discovered or suspected, but also to discover new disease loci associations. The results of experiments using simulated and real data sets are presented. Our results concerning simulated data sets indicate that the BNPP exhibits both better evaluation and discovery performance than does a p-value based method. For the real data sets, previous findings in the literature are confirmed and additional findings are found.

Conclusions/significance: We conclude that the BNPP resolves a pressing problem by providing a way to compute the posterior probability of complex multi-locus hypotheses. A researcher can use the BNPP to determine the expected utility of investigating a hypothesis further. Furthermore, we conclude that the BNPP is a promising method for discovering disease loci associations.


Conflict of interest statement

Competing Interests: The authors have declared that no competing interests exist.

Figures

Figure 1
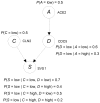
Figure 1. A Bayesian network showing possible relationships among gene expression levels.
The levels have been discretized to the values low and high. The network is for illustration purposes only; it is not meant to accurately portray real relationships.
Figure 2
Figure 2. DAG models representing associations between SNPs and a disease.
Figure 3
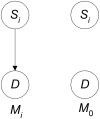
Figure 3. The model that Si is associated with D all by itself is on the left and the model that it is not is on the right.
Figure 4
Figure 4. The model that Si and Sj together are associated with D is on left; the three competing models are on the right.
Figure 5
Figure 5. A 3-SNP model and its competing models.
Figure 6
Figure 6. ROC curves concerning the posterior probabilities when the prior is 0.00001 and the p-values for the simulated data sets.
The curve for the posterior probability is a solid line, while the one for the p-values is a dashed line. 1-specificity is on the x-axis and the sensitivity is on the y-axis.
Figure 7
Figure 7. ROC curve concerning the posterior probabilities when the prior is 0.00001 and the p-values for models 55–59.
The curve for the posterior probability is a solid line, the one for the p-value is a dashed line, and the one for the p-value with the Šidák correction is a dotted line. 1-specificity is on the x-axis and the sensitivity is on the y-axis.
Figure 8
Figure 8. Bar charts showing the number of 1-locus models in each posterior probability range.
The posterior probability is that of the model in which a single locus is associated with LOAD.
Figure 9
Figure 9. Bar charts showing the number of models in each posterior probability range.
The posterior probability is that of the 2-locus model in which each locus together with APOE is associated with LOAD.

Similar articles

Cited by

References

    1. Hunter DJ, Kraft P, Jacobs KB, Cox DG, Yeager M, et al. A genome-wide association study identifies alleles in FGFR2 associated with risk of sporadic postmenopausal breast cancer. Nature Genetics. 2007;39:870–874. - PMC - PubMed
    1. Easton DF, Pooley KA, Dunning AM, Pharoah PDP, Thompson D, Ballinger DG, et al. Genome-wide association study identifies novel breast cancer susceptibility loci. Nature. 2007;447:1087–1093. - PMC - PubMed
    1. Reiman EM, Webster JA, Myers AJ, Hardy J, Dunckley T, et al. GAB2 alleles modify Alzheimer's risk in APOE carriers. Neuron. 2007;54:713–720. - PMC - PubMed
    1. The Cancer Genome Atlas Research Network. Comprehensive genomic characterization defines human glioblastoma genes and core pathways. Nature. 2008;455:1061–1067. - PMC - PubMed
    1. Ding L, Getz G, Wheeler DA, Mardis ER, McLellan MD, et al. Somatic mutations affect key pathways in lung adenocarcinoma. Nature. 2008;455:1069–1075. - PMC - PubMed

Publication types