. 2011;6(8):e22446.
doi: 10.1371/journal.pone.0022446. Epub 2011 Aug 10.

Characterization of the MDSC proteome associated with metastatic murine mammary tumors using label-free mass spectrometry and shotgun proteomics

Affiliations

Characterization of the MDSC proteome associated with metastatic murine mammary tumors using label-free mass spectrometry and shotgun proteomics

Angela M Boutté et al. PLoS One. 2011.

Abstract

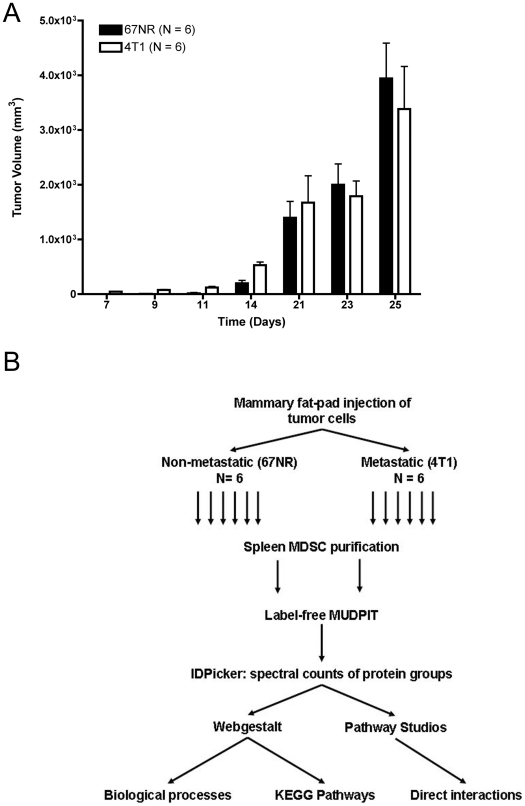
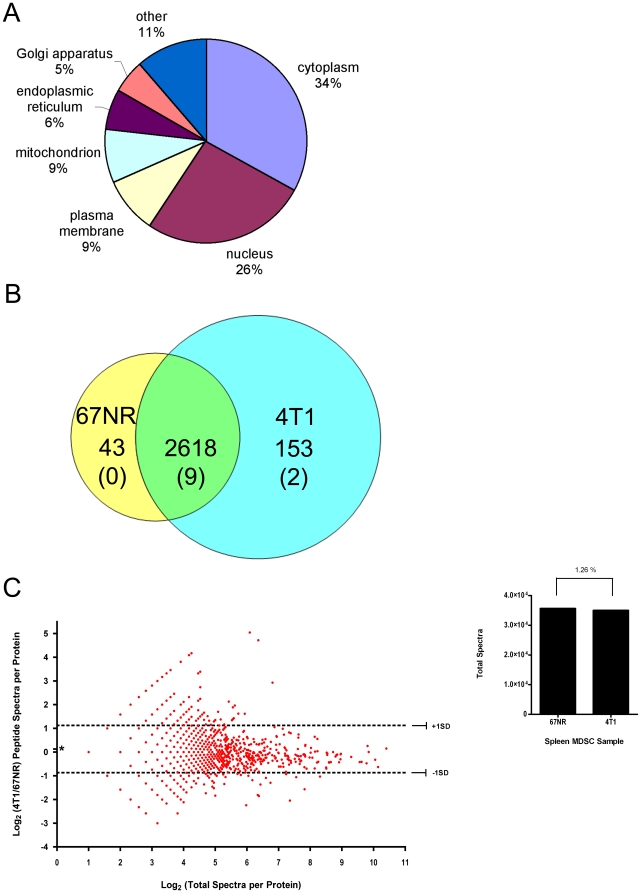
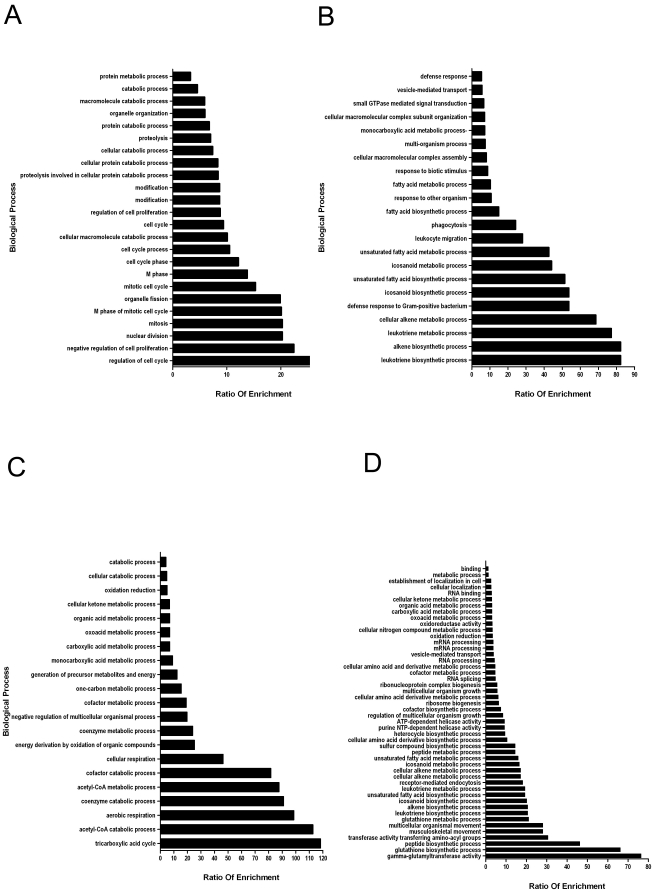
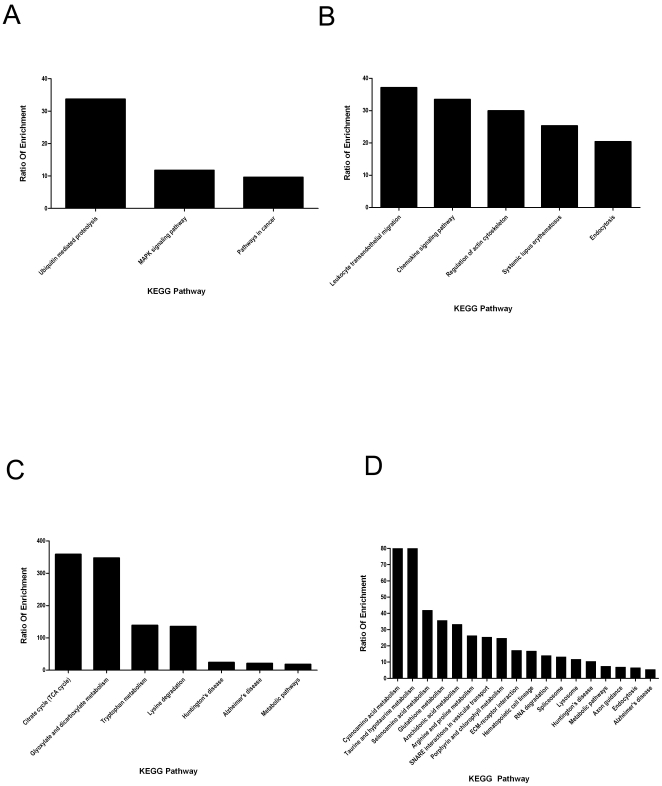
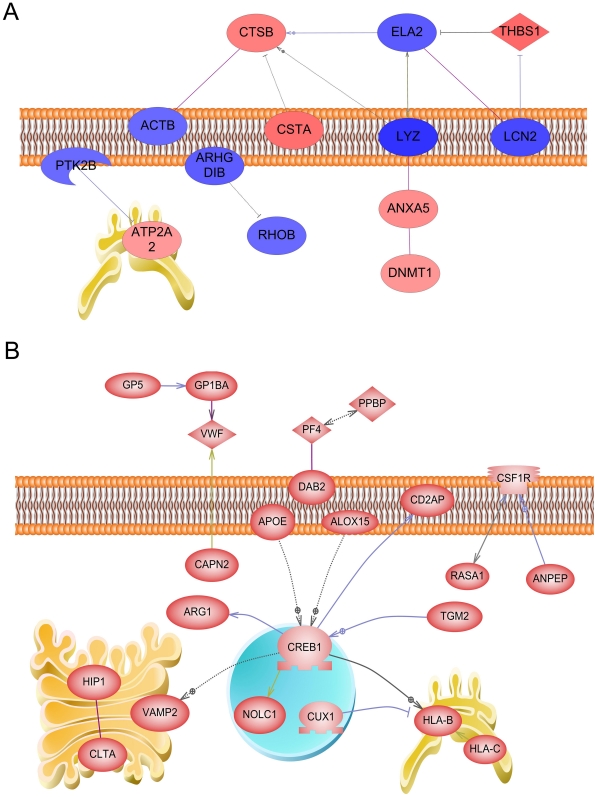
Expansion of Gr-1+/CD11b+ myeloid derived suppressor cells (MDSCs) is governed by the presence of increasingly metastatic, malignant primary tumors. Metastasis, not the primary tumor, is often the cause of mortality. This study sought to fully characterize the MDSC proteome in response to metastatic and non-metastatic mammary tumors using label-free mass spectrometry shotgun proteomics in a mouse model with tumor cell lines, 67NR and 4T1, derived from the same tumor. 67NR cells form only primary mammary tumors, whereas 4T1 cells readily metastasize to the lungs, lymph nodes, and blood. Overall analysis identified a total of 2825 protein groups with a 0.78% false discovery rate. Of the 2814 true identifications, 43 proteins were exclusive to the 67NR group, 153 were exclusive to the 4T1 group, and 2618 were shared. Among the shared cohort, 26 proteins were increased and 31 were decreased in the metastatic 4T1 cohort compared to non-metastatic 67NR controls after filtering. MDSCs selectively express proteins involved in the γ-glutamyl transferase, glutathione synthase pathways, CREB transcription factor signaling, and other pathways involved in platelet aggregation, as well as lipid and amino acid metabolism, in response to highly metastatic 4T1 tumors. Cell cycle regulation dominated protein pathways and ontological groups of the 67NR non-metastatic group. Not only does this study provide a starting point to identify potential biomarkers of metastasis expressed by MDSCs; it identifies critical pathways that are unique to non-metastatic and metastatic conditions. Therapeutic interventions aimed at these pathways in MDSC may offer a new route to control malignancy and metastasis.


Conflict of interest statement

Competing Interests: The authors have declared that no competing interests exist.

Figures

Figure 1
Figure 1. Growth kinetics of mammary tumors and proteomics experimental design.
(A) Growth kinetics of mammary tumors. 500, 000 67NR or 4T1 cells were injected into the mammary fat-pad of female Balb/c AnHsd mice. The tumor volume between groups is non-significant by 2-way ANOVA. (B) Workflow outlining the semi-quantitative proteomic analysis of purified spleen MDSCs from matched non-metastatic and metastatic tumor bearing mice.
Figure 2
Figure 2. Sub-cellular distribution and quantification of the MDSC proteome in response to tumor metastatic potential.
Duplicate SCX-LC-MS/MS injections of MDSCs isolated from 4T1 or 67NR tumor bearing mice were performed. (A) Each of the 2825 protein groups identified and parsed by IDPicker were analyzed using Pathway Studio and sorted by ontological group. The pie chart indicates the percentage of proteins that fall into each ontological group. (B) Union diagram of protein groups. Proteins that were shared among both groups or found exclusively in either group are indicated. The numbers of proteins found exclusively in the 67NR group (left), in both groups (middle), and exclusively in the 4T1 group (right) are indicated. The number of proteins identified from the decoy database are indicated ( ) in each MDSC group. (C) Scatter plot distribution of co-expressed MDSC proteins. The fold change is calculated as the log2 of spectral counts identified in MDSCs from mice with metastatic 4T1 tumors compared to those bearing non-metastatic 67NR tumors (Y-axis) compared to the total number of spectra per protein (X-axis). The average fold change 0.128 is indicated by an asterisk (*). Log2 fold change spectral counts that are one standard deviation from the mean are indicated by dashed lines (-·-·-) and are considered significant. Confirmation of equal loading during LC-MS/MS is indicated. The total spectral count per group, 67NR or 4T1, is indicated (inset). The coefficient of variance between the 67NR and 4T1 MDSC groups is 1.25%.
Figure 3
Figure 3. Unbiased determination of biological processes involved in MDSC response to tumor metastatic potential.
Unbiased approach was used to define the most over-represented biological groups and pathways as indicated by Webgestalt. The number of proteins in each group or pathway is displayed as the “Ratio of Enrichment” (X-axis). Webgestalt generated categories (Y-axis) and the number of proteins in each pathway is displayed as the “Ratio of Enrichment” (X-axis). Categories listed on the X-axis that are most prominent values are considered the most pertinent. The protein groups used to determine enriched biological processes in each metastatic group are displayed (A) 67NR only, (B) decreased in 4T1 compared to 67NR, (C) increased in 4T1 compared to 67NR, and (D) 4T1 only.
Figure 4
Figure 4. Unbiased determination of protein pathways involved in MDSC response to tumor metastatic potential.
Unbiased approach was used to define the most over-represented KEGG pathways as indicated by Webgestalt. Webgestalt generated categories (X-axis) and the number of proteins in each pathway is displayed as the “Ratio of Enrichment” (Y-axis). The most prominent values are considered the most pertinent. The protein groups used to determine enriched biological processes in each metastatic group are displayed (A) 67NR only, (B) decreased in 4T1 compared to 67NR, (C) increased in 4T1 compared to 67NR, and (D) 4T1 only.
Figure 5
Figure 5. Pathway analysis of the MDSC proteome in response to non-metastatic or metastatic tumors.
Candidate proteins were uploaded into the Pathway Studio program after manually filtering for protein groups with 25–300 total spectra as described. Proteins in each group were analyzed for direct interactions and localization as determined by Pathway Studio. Binding partners (solid purple line), activating proteins (grey-blue line and arrowhead), inhibitory proteins (grey line and bar) are shown. Proposed interactions are indicated by dashed lines (-·-·-) and evidence-based interactions are indicated with solid lines (—). The plasma membrane and the organelles are illustrated to indicate protein localization. (A) Differentially abundant proteins in 67NR and in 4T1-MDSCs. Proteins increased (purple to red) or decreased (blue to purple) in 4T1-MDSCs compared to 67NR-MDSCs. (B) Proteins exclusively detected in 4T1-MDSCs.

References

    1. Coussens LM, Werb Z. Inflammation and cancer. Nature. 2002;420:860–867. - PMC - PubMed
    1. Greten TF, Manns MP, Korangy F. Myeloid derived suppressor cells in human diseases. Int Immunopharmacol. 2011;11:802–806. - PMC - PubMed
    1. Ribechini E, Greifenberg V, Sandwick S, Lutz MB. Subsets, expansion and activation of myeloid-derived suppressor cells. Med Microbiol Immunol. 2010;199:273–281. - PubMed
    1. Youn JI, Nagaraj S, Collazo M, Gabrilovich DI. Subsets of myeloid-derived suppressor cells in tumor-bearing mice. J Immunol. 2008;181:5791–5802. - PMC - PubMed
    1. Almand B, Clark JI, Nikitina E, van Beynen J, English NR, et al. Increased production of immature myeloid cells in cancer patients: a mechanism of immunosuppression in cancer. J Immunol. 2001;166:678–689. - PubMed

Publication types