. 2011;6(8):e23389.
doi: 10.1371/journal.pone.0023389. Epub 2011 Aug 11.

Overexpression of ubiquitin specific protease 44 (USP44) induces chromosomal instability and is frequently observed in human T-cell leukemia

Affiliations

Overexpression of ubiquitin specific protease 44 (USP44) induces chromosomal instability and is frequently observed in human T-cell leukemia

Ying Zhang et al. PLoS One. 2011.

Abstract

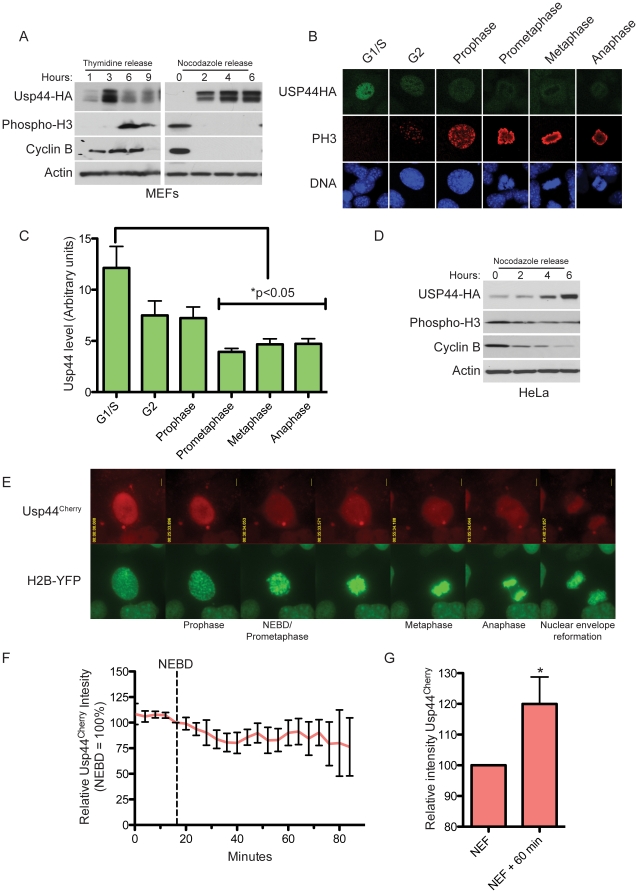
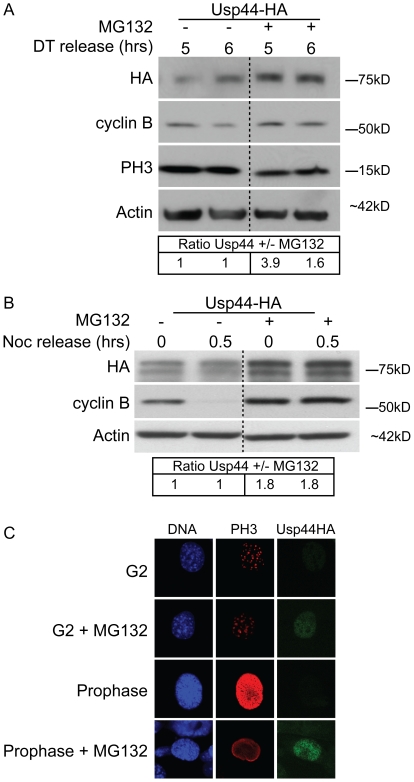
Cdc20-anaphase promoting complex/cyclosome (Cdc20-APC/C) E3 ubiquitin ligase activity is essential for orderly mitotic progression. The deubiqituinase USP44 was identified as a key regulator of APC/C and has been proposed to suppress Cdc20-APC/C activity by maintaining its association with the inhibitory protein Mad2 until all chromosomes are properly attached to the mitotic spindle. However, this notion has been challenged by data in which a lysine-less mutant of Cdc20 leads to premature anaphase, suggesting that it's ubiquitination is not required for APC/C activation. To further evaluate its role in checkpoint function and chromosome instability, we studied the consequences of over-expression of mouse Usp44 in non-transformed murine embryonic fibroblasts. Here we show that cells with high Usp44 are prone to chromosome segregation errors and aneuploidization. We find that high Usp44 promotes association of Mad2 with Cdc20 and reinforces the mitotic checkpoint. Surprisingly, the APC/C-Cdc20 substrate cyclin B1 is stabilized in G2 when Usp44 is over-expressed, but is degraded with normal kinetics once cells enter mitosis. Furthermore, we show that USP44 expression is elevated in subset of T-cell leukemias. These data are consistent with an important role for USP44 in regulating Cdc20-APC/C activity and suggest that high levels of this enzyme may contribute to the pathogenesis of T-ALL.


Conflict of interest statement

Competing Interests: The authors have declared that no competing interests exist.

Figures

Figure 1
Figure 1. Expression of Usp44 leads to chromosome missegregation and aneuploidy.
(a) Expression of Usp44-HA in MEFs as seen by immunoblotting (upper) or quantitative real-time (qRT)-PCR (lower). Four independent MEF lines were transduced with Usp44-HA or Usp44Cherry followed by TaqMan qRT-PCR. Expression was normalized to GAPDH, and fold-change was calculated using the ΔCt method. (b) MEFs stably transduced with either empty vector (n = 78 cells), Usp44-HA (n = 106 cells), or Usp44Cherry (n = 53 total) were analyzed by live-cell microscopy through the indicated numbers of un-perturbed cell divisions. Chromosomes were visualized by transduction with lentivirus encoding histone H2B fused with yellow fluorescent protein (H2B-YFP). The results depict the average and standard error from three-independent MEF lines. (c) Example of a cell with a lagging chromosome (upper) and anaphase bridge (lower). (d) Karyotype analysis of low passage MEFs. Stable transduction with the indicated lentivirus was performed at passage 2. N (metaphases)  = 175 (Empty vector control) and 223 (Usp44-HA) from a total of four independent MEF lines per genotype. (e) Representative spectral karyotype (SKY) of a cell expressing Usp44-HA. Note this cell has a normal chromosome number (40) but has a trisomy of chromosome 12 and monosomy of chromosome 7. * p<0.05 calculated with the unpairted t-test. Error bars represent the SEM.
Figure 2
Figure 2. Usp44 expression leads to reduced mitotic slippage.
(a) The duration of mitotic arrest in nocodazole was determined for MEFs transduced with either empty vector or Usp44-HA (n = 40–60 cells each). Chromosomes were visualized by prior transduction with lentivirus expressing H2B-YFP. After the addition of nocodazole, cells entering mitosis (for up to 20 minutes) were marked and followed by time lapse imaging for over 9 hours. The duration of arrest was defined as the time from nuclear envelope breakdown (NEBD) to de-condensation of chromosomes and nuclear reformation. (b) The duration of mitosis was determined by live-cell microscopy of MEFs with the indicated constructs. All cells were transduced with H2B-YFP and the time from nuclear envelope breakdown (NEBD) to anaphase onset was determined. N = 79 cells with control, 84 with Usp44-HA, 21 Usp44CherryLO, 20 Usp44CherryHI. p-values were calculated using the 2-way ANOVA. (c) The growth of cells was determined for three independent MEF lines transduced with either empty vector, or Usp44-HA. Viable cells were counted daily in triplicate using trypan blue exclusion. (d) Immunoprecipitation of Cdc27 from MEFs with or without over-expressed Usp44-HA. Precipitated material was immunoblotted with the indicated antibodies. (e) Immunoprecipitation of Cdc20 from MEFs with or without over-expressed Usp44-HA. Two results out of six independent experiments are shown. Relative amounts of Mad2 and BubR1, normalized to the mount of Cdc27 retrieved, are shown. (f) Three independent MEF lines were transduced with the indicated constructs and mitotic cells isolated by shake-off in the presence of nocodazole. Extracts were probed with the indicated antibodies. (g) Cdc20 localization was assessed by confocal microscopy on MEF cultures transduced with the indicated constructs. Images are representative of the results seen in three independent MEF lines. Relative amounts of Cdc20, normalized to the amount of PH3, are shown. * Unless otherwise noted, p<0.05 for each indicated time point calculated with an unpaired t-test. Error bars represent the SEM.
Figure 3
Figure 3. Excess Usp44 leads to increased cyclin B in early mitosis.
(a) Cells were synchronized in G1/G0 by serum starvation and were then released. Nocodazole was added 23 hours after release. Samples were collected at the indicated times and were immunoblotted with the indicated antibodies. Results are representative of at least 3 independent experiments. (b) Immunofluorescence imaging of cells transduced with empty lentivirus or Usp44-HA using the indicated antibodies. The stage of mitosis was determined by DNA morphology. (c) Quantitation of cyclin B levels from (a) using imageJ. Ten cells from each of three independent MEF lines (total 30 cells per condition per stage) were analyzed. (d) Cyclin B1 mRNA was measured using qRT-PCR. Cells were synchronized as in (a) and harvested at the indicated times. (e) MEFs were stably transduced with the indicated construct and were then transfected with a construct encoding a fusion between cyclin B1 and Cerulean (CyclinB1Cerulean). Cells were monitored by live-cell microscopy. Images were obtained every 4 minutes and quantified with imageJ. Values were normalized such that the level at nuclear envelope breakdown (NEBD) was set at 100%. The arrow with “A:” refers to the average time of anaphase observed in the cells in each condition. (f) MEFs were transduced with the indicated constructs and were fixed and stained to detect Usp44Cherry, cyclin B1, and DNA. The levels of Usp44Cherry and cyclin B1 were quantitated in G2 cells (n = 11–19 cells each) using imageJ. (g) MEFs transduced with empty vector were treated with MG132 for 1 hour prior to fixation. The amount of cyclin B1 was determined in G2 or early prophase using imageJ in comparison to untreated, or Usp44Cherry transduced MEFs. Graph represents the average of 20 cells in each group from three independent experiments. * p<0.05 calculated with an unpaired t-test.
Figure 4
Figure 4. Usp44 undergoes degradation prior to mitosis.
(a) Immunoblot of cells expressing Usp44-HA previously synchronized with double thymidine (DT) or nocodazole (Noc). Samples were harvested at the indicated times after release, and were immunoblotted with the indicated antibodies. (b) Immunofluorescence images of Usp44-HA in different cell cycle phases. G1/S, G2, and prophase cells were distinguished based on the patterns of chromosome condensation and phospho histone H3 staining (absent in G1/S, punctate in G2 and prophase). Staining performed with the indicated antibodies. (c) quantitation of immunofluorescence from (b). Levels of HA immunoreactivity were determined using imageJ (n = 8 cells each). (d). HeLa cells were analyzed as in (a). (e) Time-lapse images of a representative mitotic MEF expressing Usp44Cherry and H2B-YFP. Relative times are indicated. (f) Quantitation of Usp44Cherry fluorescence (n = 10) in MEFs monitored by live-cell microscopy from late G2 through anaphase. The levels of mCherry fluorescence were determined using imageJ. (g). MEFs expressing Usp44Cherry (n = 9) were monitored by live cell microscopy and the levels of mCherry fluorescence was measured at nuclear envelope re-formation (NEF) and at NEF+60 minutes. * p<0.05 calculated with an unpaired t-test. Error bars represent the SEM.
Figure 5
Figure 5. Usp44 is degraded by the proteasome.
(a, b) Immunoblots of MEFs synchronized either by double-thymidine block (a) or mitotic shake-off (b), expressing Usp44-HA. Cells were incubated with MG132 3 hours after double-thymidine release or one hour prior to mitotic shake off. Relative quantitation was performed using imageJ. (c) Immunofluorescence images of cells expressing Usp44-HA treated (where indicated) with MG132 one hour prior to fixation.
Figure 6
Figure 6. USP44 is over-expressed in T-cell acute lymphoblastic leukemia.
(a) Relative USP44 mRNA expression in various cancer types versus matched normal tissue was collected from publicly available microarray studies (www.oncomine.org). For all studies shown, p<0.05 for alterations in USP44 mRNA. (b) USP44 mRNA was measured by TaqMan quantitative real-time PCR in a series of 24 samples of T-cell acute lymphoblastic leukemia compared with peripheral T-cells isolated from 10 healthy volunteers. The p value was calculated with an unpaired t-test comparing the mean fold-change of T-ALL to controls. (c) Human foreskin fibroblasts were transduced with the indicated constructs (two independent lines for each), cultured for 5-passages, and then analyzed by chromosome counting. The p value was calculated using the unpaired t test.

Similar articles

Cited by

References

    1. Weaver BA, Cleveland DW. The aneuploidy paradox in cell growth and tumorigenesis. Cancer Cell. 2008;14:431–433. - PMC - PubMed
    1. Ricke RM, van Ree JH, van Deursen JM. Whole chromosome instability and cancer: a complex relationship. Trends Genet. 2008;24:457–466. - PMC - PubMed
    1. Weaver BA, Silk AD, Montagna C, Verdier-Pinard P, Cleveland DW. Aneuploidy acts both oncogenically and as a tumor suppressor. Cancer Cell. 2007;11:25–36. - PubMed
    1. Weaver BA, Cleveland DW. The role of aneuploidy in promoting and suppressing tumors. J Cell Biol. 2009;185:935–937. - PMC - PubMed
    1. Kolodner RD, Putnam CD, Myung K. Maintenance of genome stability in Saccharomyces cerevisiae. Science. 2002;297:552–557. - PubMed

Publication types

MeSH terms