

Metabolomic profile of hepatitis C virus-infected hepatocytes
- PMID: 21853158
- PMCID: PMC3154941
- DOI: 10.1371/journal.pone.0023641
Metabolomic profile of hepatitis C virus-infected hepatocytes
Abstract
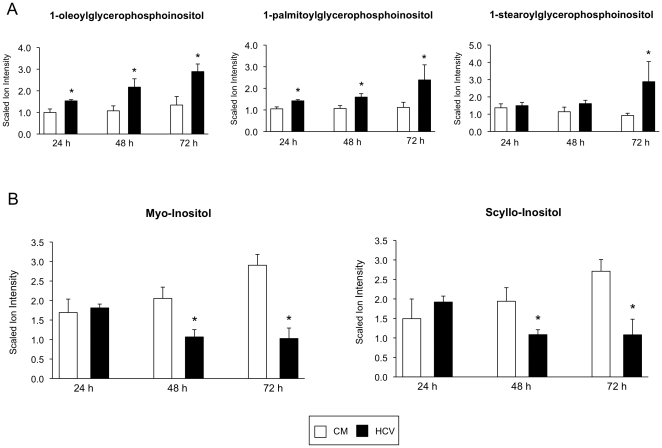
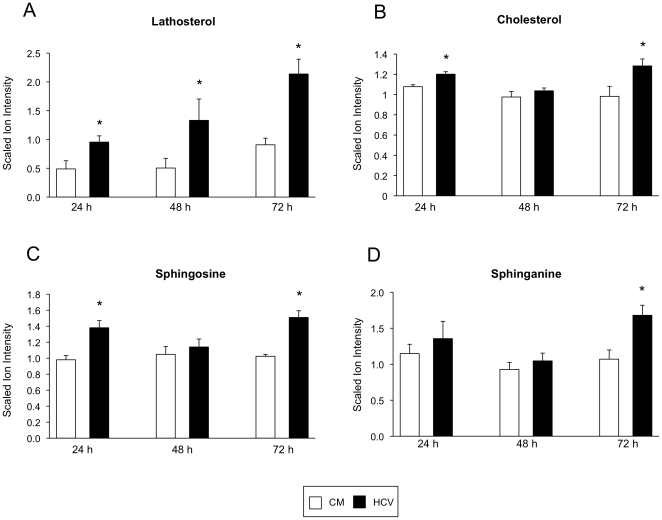
Hepatitis C virus (HCV) is capable of disrupting different facets of lipid metabolism and lipids have been shown to play a crucial role in the viral life cycle. The aim of this study was to examine the effect HCV infection has on the hepatocyte metabolome. Huh-7.5 cells were infected using virus produced by the HCV J6/JFH1 cell culture system and cells were harvested 24, 48, and 72-hours following infection. Metabolic profiling was performed using a non-targeted multiple platform methodology combining ultrahigh performance liquid chromatography/tandem mass spectrometry (UHPLC/MS/MS(2)) and gas chromatography/mass spectrometry (GC/MS). There was a significant increase in a number of metabolites involved in nucleotide synthesis and RNA replication during early HCV infection. NAD levels were also significantly increased along with several amino acids. A number of lipid metabolic pathways were disrupted by HCV infection, resulting in an increase in cholesterol and sphingolipid levels, altered phospholipid metabolism and a possible disruption in mitochondrial fatty acid transport. Fluctuations in 5'-methylthioadenosine levels were also noted, along with alterations in the glutathione synthesis pathway. These results highlight a number of previously unreported metabolic interactions and give a more in depth insight into the effect HCV has on host cell biochemical processes.
Conflict of interest statement
Figures


Similar articles
-
Prominent steatosis with hypermetabolism of the cell line permissive for years of infection with hepatitis C virus.PLoS One. 2014 Apr 9;9(4):e94460. doi: 10.1371/journal.pone.0094460. eCollection 2014. PLoS One. 2014. PMID: 24718268 Free PMC article.
-
Complex lipid metabolic remodeling is required for efficient hepatitis C virus replication.Biochim Biophys Acta Mol Cell Biol Lipids. 2018 Sep;1863(9):1041-1056. doi: 10.1016/j.bbalip.2018.06.002. Epub 2018 Jun 6. Biochim Biophys Acta Mol Cell Biol Lipids. 2018. PMID: 29885363
-
[Inhibition of silent information regulator-1 in hepatocytes induces lipid metabolism disorders and enhances hepatitis C virus replication].Zhonghua Gan Zang Bing Za Zhi. 2013 Nov;21(11):834-9. doi: 10.3760/cma.j.issn.1007-3418.2013.11.009. Zhonghua Gan Zang Bing Za Zhi. 2013. PMID: 24331693 Chinese.
-
Hepatitis C virus hijacks host lipid metabolism.Trends Endocrinol Metab. 2010 Jan;21(1):33-40. doi: 10.1016/j.tem.2009.07.005. Epub 2009 Oct 23. Trends Endocrinol Metab. 2010. PMID: 19854061 Free PMC article. Review.
-
Primary hepatocytes as targets for hepatitis C virus replication.J Viral Hepat. 2008 Dec;15(12):849-54. doi: 10.1111/j.1365-2893.2008.01051.x. J Viral Hepat. 2008. PMID: 19087224 Free PMC article. Review.
Cited by
-
Lymphocytes as liver damage mirror of HCV related adipogenesis deregulation.PLoS One. 2014 Mar 21;9(3):e92343. doi: 10.1371/journal.pone.0092343. eCollection 2014. PLoS One. 2014. PMID: 24658135 Free PMC article.
-
Correlation analysis of urine metabolites and clinical staging in patients with ovarian cancer.Int J Clin Exp Med. 2015 Oct 15;8(10):18165-71. eCollection 2015. Int J Clin Exp Med. 2015. PMID: 26770415 Free PMC article.
-
Dengue virus induces and requires glycolysis for optimal replication.J Virol. 2015 Feb;89(4):2358-66. doi: 10.1128/JVI.02309-14. Epub 2014 Dec 10. J Virol. 2015. PMID: 25505078 Free PMC article.
-
Hepatitis C virus-induced mitochondrial dysfunctions.Viruses. 2013 Mar 21;5(3):954-80. doi: 10.3390/v5030954. Viruses. 2013. PMID: 23518579 Free PMC article. Review.
-
Ultrastructure of the replication sites of positive-strand RNA viruses.Virology. 2015 May;479-480:418-33. doi: 10.1016/j.virol.2015.02.029. Epub 2015 Mar 6. Virology. 2015. PMID: 25746936 Free PMC article. Review.
References
-
- Schmeding M, Neumann UP, Puhl G, Bahra M, Neuhaus R, et al. Hepatitis C recurrence and fibrosis progression are not increased after living donor liver transplantation: a single-center study of 289 patients. Liver Transpl. 2007;13:687–692. - PubMed
-
- The Global Burden of Hepatitis C Working Group. Global burden of disease (GBD) for hepatitis C. J Clin Pharmacol. 2004;44:20–29. - PubMed
-
- Pawlotsky JM. Pathophysiology of hepatitis C virus infection and related liver disease. Trends Microbiol. 2004;12:96–102. - PubMed
-
- Hadziyannis SJ, Sette H, Jr, Morgan TR, Balan V, Diago M, et al. Peginterferon-alpha2a and ribavirin combination therapy in chronic hepatitis C: a randomized study of treatment duration and ribavirin dose. Ann Intern Med. 2004;140:346–355. - PubMed
-
- Manns MP, McHutchison JG, Gordon SC, Rustgi VK, Shiffman M, et al. Peginterferon alfa-2b plus ribavirin compared with interferon alfa-2b plus ribavirin for initial treatment of chronic hepatitis C: a randomised trial. Lancet. 2001;358:958–965. - PubMed
Publication types
MeSH terms
Substances
LinkOut - more resources
Full Text Sources
Other Literature Sources
Medical
Miscellaneous
