

Adipogenesis and insulin sensitivity in obesity are regulated by retinoid-related orphan receptor gamma
- PMID: 21853531
- PMCID: PMC3377107
- DOI: 10.1002/emmm.201100172
Adipogenesis and insulin sensitivity in obesity are regulated by retinoid-related orphan receptor gamma
Abstract
Obesity is a well-known risk factor for the development of secondary complications such as type 2 diabetes. However, only a part of the obese population develops secondary metabolic disorders. Here, we identify the transcription factor retinoid-related orphan receptor gamma (RORγ) as a negative regulator of adipocyte differentiation through expression of its newly identified target gene matrix metalloproteinase 3. In vivo differentiation of adipocyte progenitor cells from Rorγ-deficient mice is enhanced and obese Rorγ(-/-) mice show decreased adipocyte sizes. These small adipocytes are highly insulin sensitive, leading to an improved control of circulating free fatty acids. Ultimately, Rorγ(-/-) mice are protected from hyperglycemia and insulin resistance in the state of obesity. In adipose stromal-vascular fraction from obese human subjects, Rorγ expression is correlated with adipocyte size and negatively correlated with adipogenesis and insulin sensitivity. Taken together, our findings identify RORγ as a factor, which controls adipogenesis as well as adipocyte size and modulates insulin sensitivity in obesity. RORγ might therefore serve as a novel pharmaceutical target to treat obesity-associated insulin resistance.
Copyright © 2011 EMBO Molecular Medicine.
Figures

A. mRNA expression profile of Rorγ and Mmp3 during 3T3-L1 adipogenesis. Expression was normalized to 36b4 (n = 4).
B. Fluorescent staining of 3T3-L1 adipocytes overexpressing RORγ or empty vector at day 7 of differentiation with or without rosiglitazone. Automated image acquisition (blue: nuclei, red: cytosol, green: lipid droplets, 12 pictures per well, scale: 100 µm) was followed by automated image quantification using CellProfiler (n = 4).
C. Whole cell extracts of differentiated 3T3-L1 adipocytes were blotted against the mature adipocyte marker A-FABP using γ-Tubulin as a loading control.
D,E. Fluorescent staining (n = 4) and A-FABP Western blot of differentiated 3T3-L1 cells transfected with control siRNA or siRNA against RORγ 3 days before induction of differentiation. The results shown are representative of three independent differentiation experiments. Values represent means ± SD, *p ≤ 0.05, **p ≤ 0.01 and ***p ≤ 0.001.

A. Western blot of nuclear extracts (RORγ, PPARγ, C/EBPα, C/EBPβ and C/EBPδ) or cytosolic extracts (MMP3, PREF-1, LPL and Adiponectin) during differentiation of 3T3-L1 cells overexpressing RORγ or empty vector. Differentiation without rosiglitazone was induced at time point 0 h. Lamin B and γ-Tubulin were used as loading controls.
B,C,D. qPCR for the adipogenic genes c-Jun, c-Fos and A-Fabp during differentiation of 3T3-L1 cells overexpressing RORγ or empty vector (n = 4).
E. Firefly luciferase activity of the PPARγ response element (PPRE) normalized to renilla luciferase before, 1 and 2 days after induction of differentiation in 3T3-L1 cells overexpressing RORγ or empty vector (n = 4).
F. Firefly luciferase activity of PPARγ promoter normalized to renilla luciferase in 3T3-L1 cells overexpressing RORγ or empty vector during differentiation at indicated time points (n = 8). The results shown are representative of three independent experiments. Values represent means ± SD, *p ≤ 0.05, **p ≤ 0.01 and ***p ≤ 0.001.
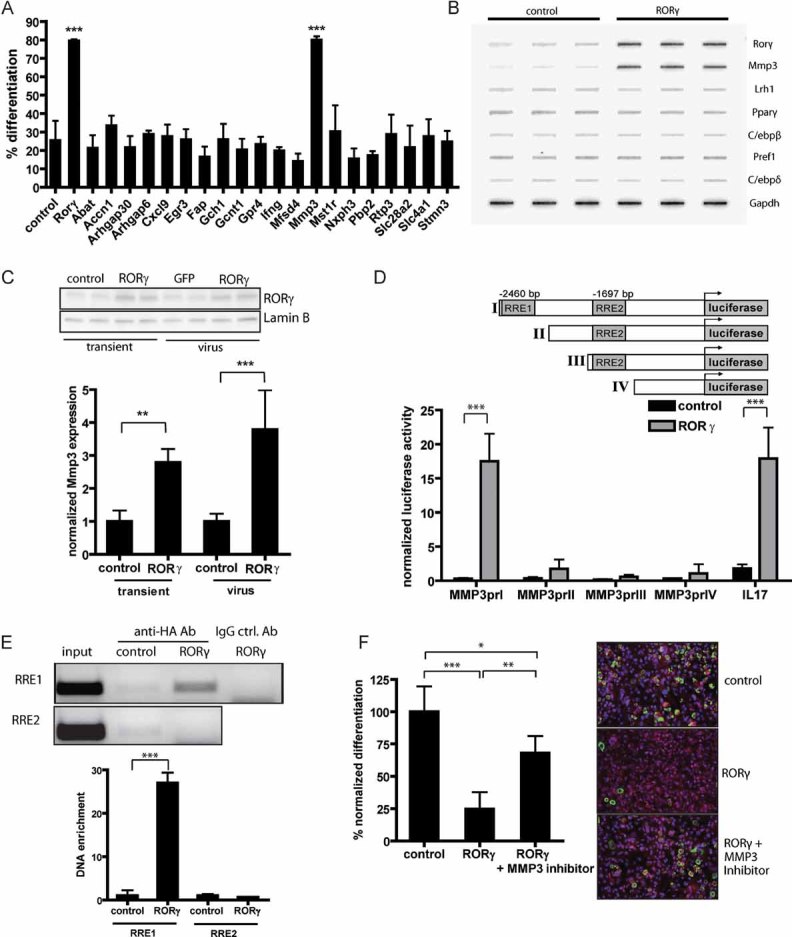
Functional siRNA screen of potential RORγ target genes identified by microarray analysis of 3T3-L1 cells overexpressing RORγ. 3T3-L1 cells were transfected with siRNA pools, differentiated and fluorescently stained to assess the percentage of differentiated cells (n = 4).
Nuclear run-on assay for transcriptional activity of genes in undifferentiated 3T3-L1 cells infected with control or RORγ-overexpressing lentivirus. 32P-labelled mRNA was hybridized to cDNA from the indicated genes on a slot blot and analysed by autoradiography.
Expression of Mmp3 mRNA in 3T3-L1 preadipocytes overexpressing RORγ by transient transfection or viral infection.
MMP3 promoter constructs with potential ROR response elements (RREs) cloned into a luciferase reporter vector. Luciferase assay in 3T3-L1 preadipocytes overexpressing RORγ or control vector 48 h after transfection normalized to renilla luciferase activity. Activation of IL17 promoter was used as a control (n = 4).
Chromatin immunoprecipitation of RORγ in 3T3-L1 cells using anti-HA antibody 6 days after infection with RORγ or control lentivirus. DNA was quantified by qPCR using specific primers for RRE1 and RRE2 and normalized to input (n = 3).
Fluorescent staining of differentiated 3T3-L1 adipocytes expressing RORγ or control vector during differentiation treated with or without 20 µM of MMP3 inhibitor 2 days before and after induction of differentiation (scale: 100 µm). The results shown are representative of three independent experiments. Values represent means ± SD, *p ≤ 0.05 and **p ≤ 0.01, ***p ≤ 0.001.

A. Injection of SVF from different donor mice (as indicated) into the scapular subcutaneous region of C57Bl/6 mice. Fat pads were excised after 6 or 4 weeks of HFD feeding and stained as indicated.
B. Quantification of adipocyte differentiation in SVF transplants from wild-type and Rorγ−/− mice fed a high-fat diet for 4 weeks (n = 5).
C. Mean adipocyte size of Rorγ−/− and wild-type mice crossed into the ob/ob background or fed a high-fat diet for 8 weeks, insets are fat sections from representative samples of female DIO wild-type and Rorγ−/− mice (n = 7–10).
D,E. Adipocyte size distributions from subcutaneous and visceral adipose tissue of female DIO wild-type and Rorγ−/− mice (n = 7).
F. Mmp3 mRNA expression in visceral SVF of Rorγ−/− and wild-type mice on chow diet (n = 5). Values represent means ± SD, *p ≤ 0.05, **p ≤ 0.01 and ***p ≤ 0.001.
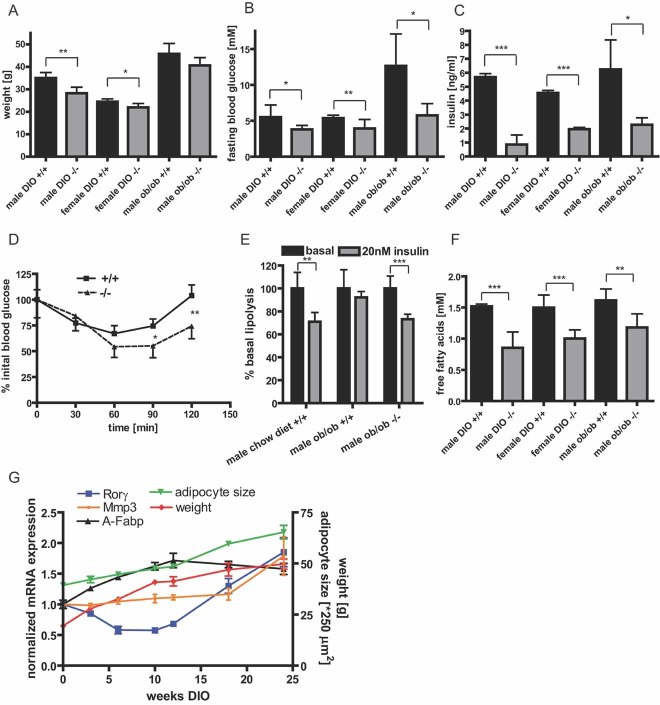
A. Body weight of Rorγ−/− and wild-type mice (12 weeks) crossed into the ob/ob background or fed a high-fat diet (DIO) for 8 weeks (n = 7–10).
B,C. Fasting blood glucose and serum insulin of ob/ob and high-fat diet Rorγ−/− and wild-type mice (n = 7–10).
D. Insulin tolerance test with male Rorγ−/− and wild-type mice after 8 weeks of high-fat diet injected intraperitoneal (i.p.) with 0.75 U/kg insulin (n = 7).
E. In vitro lipolysis of isolated adipocytes from 12-week-old wild-type mice on a chow diet, ob/ob wild-type and ob/ob Rorγ−/− mice treated with or without insulin normalized to cell number and set to 100% for basal lipolysis (n = 4).
F. Fasting free fatty acid serum concentrations of ob/ob and high-fat diet Rorγ−/− and wild-type mice (n = 7–10).
G. Expression of Rorγ, Mmp3 and A-Fabp in visceral adipose tissue of male C57Bl/6 mice during a time course of high-fat diet feeding. Body weight and mean adipocyte size of the animals was monitored.
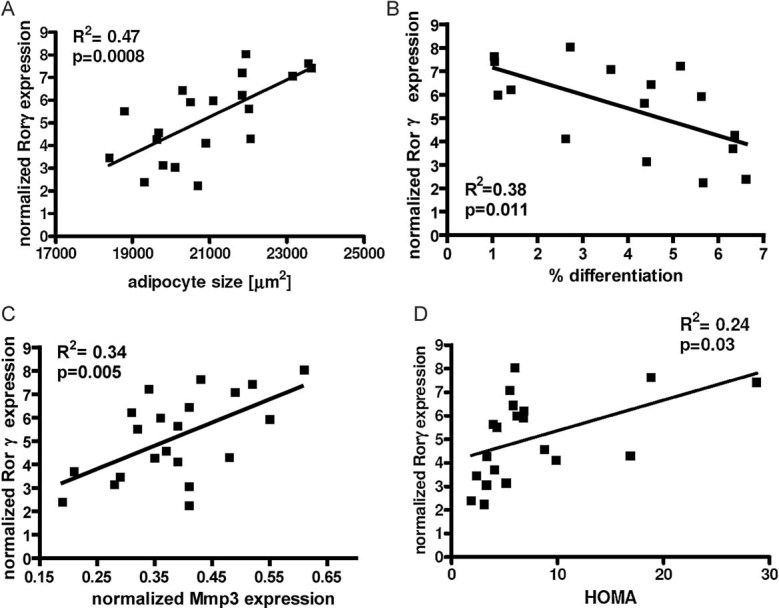
Rorγ mRNA expression normalized to Gapdh in human subcutaneous SVF of obese subjects plotted against mean adipocyte cell size (n = 20).
Rorγ mRNA expression in human subcutaneous SVF of obese subjects plotted against percent in vitro differentiated adipocytes of human subcutaneous SVF (n = 16).
Rorγ mRNA expression plotted against Mmp3 expression in subcutaneous SVF of obese patients (n = 21).
Rorγ expression in subcutaneous SVF plotted against HOMA index of obese subjects (n = 20). Values represent means ± SD, *p ≤ 0.05, **p ≤ 0.01 and ***p ≤ 0.001.
References
-
- Austin S, Medvedev A, Yan ZH, Adachi H, Hirose T, Jetten AM. Induction of the nuclear orphan receptor ROR gamma during adipocyte differentiation of D1 and 3T3-L1cells. Cell Growth Differ. 1998;9:267–276. - PubMed
-
- Bouloumie A, Sengenes C, Portolan G, Galitzky J, Lafontan M. Adipocyte produces matrix metalloproteinases 2 and 9: involvement in adipose differentiation. Diabetes. 2001;50:2080–2086. - PubMed
-
- Chavey C, Mari B, Monthouel MN, Bonnafous S, Anglard P, Van Obberghen E, Tartare-Deckert S. Matrix metalloproteinases are differentially expressed in adipose tissue during obesity and modulate adipocyte differentiation. J Biol Chem. 2003;278:11888–11896. - PubMed
Publication types
MeSH terms
Substances
LinkOut - more resources
Full Text Sources
Other Literature Sources
Medical
Molecular Biology Databases
